6 Efficiency
Operational efficiency is a critical component in assessing the management and execution of operations. It provides insights into the management of arrival and departure flows and the associated separation and synchronisation activities. Inefficiencies can have an impact on user operations in terms of delays or excessive fuel burn. In light of the previous chapters, it is therefore interesting to study how the available capacity was utilised to service demand during the different flight phases.
The measures reported in this comparison report are based on the observed travel time for surface operations (i.e. taxi-in and taxi-out) and during the arrival phase. These travel times are compared with an associated reference time for a group of flights showing similar operational characteristics. The determined difference (i.e. additional time) measures the level of inefficiency. It must be noted that high performance operations will still yield a certain share of measured additional times. Operational efficiency therefore aims at minimising rather than eliminating these additional times as they cannot be zero.
6.1 Additional Taxi-In Time
The additional taxi-in time measures the travel time of an arriving aircraft from its touchdown, i.e. the actual landing time, to its stand/gate position, i.e. actual in-block time. This elapsed taxi-in time is compared to an anticipated reference time for aircraft arriving at the same runway and taxiing to the same (group of) stand/gate position(s). Research has shown that taxi times are not dependent on the type of aircraft. The additional taxi-in time indicator provides a measure of the management of inbound surface traffic.
For this report, the Brazilian and European taxi-in results are calculated from a harmonised PBWG data extraction format to demonstrate the benefits of global harmonisation. Based on the ICAO GANP guidance, the reference times for both regions are determined from the 2024 sample using the 20th percentile method by airport, phase, runway, and stand/gate position.
6.1.1 Annual Evolution of Additional Taxi-in Times
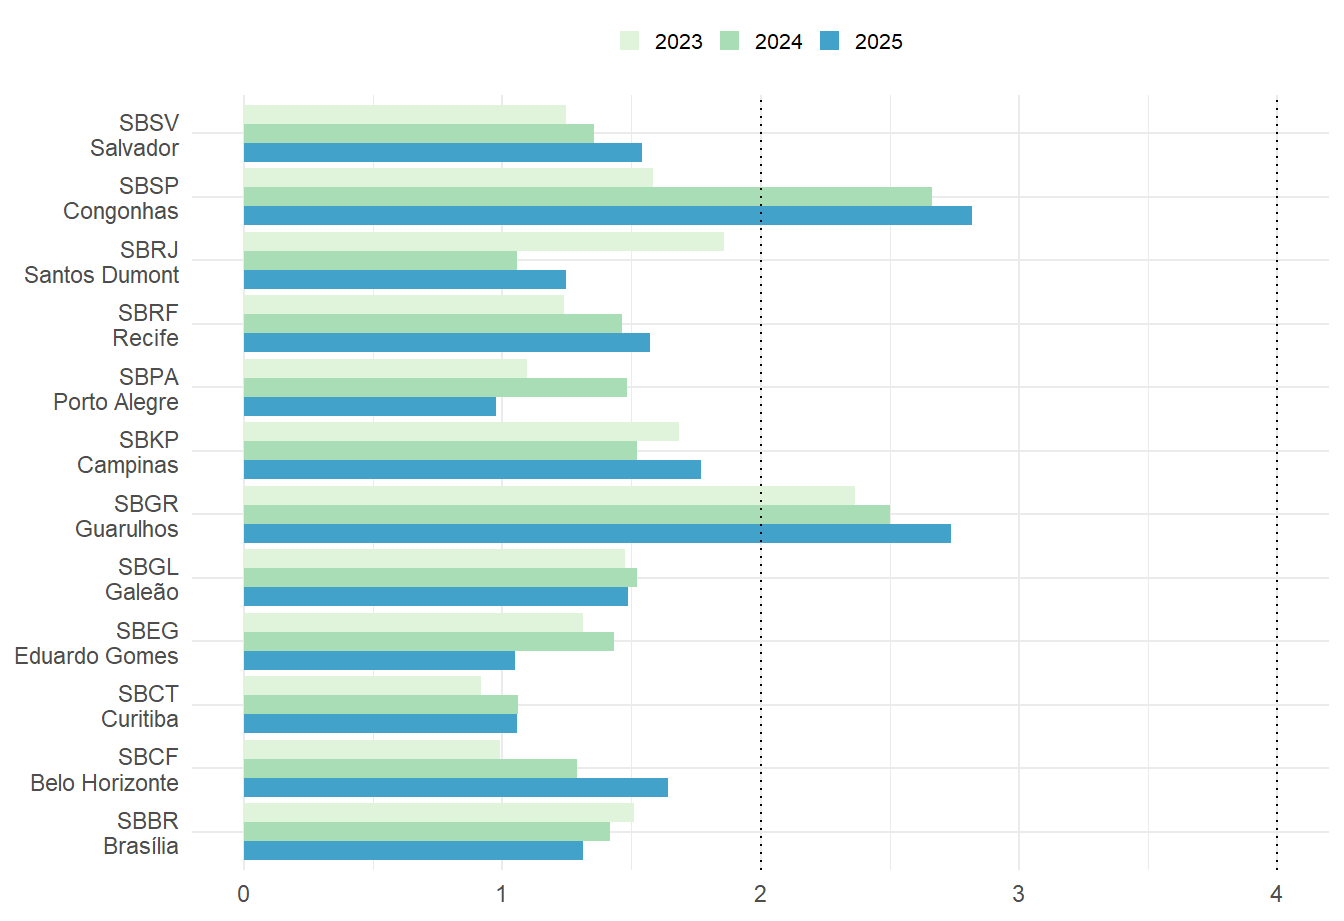
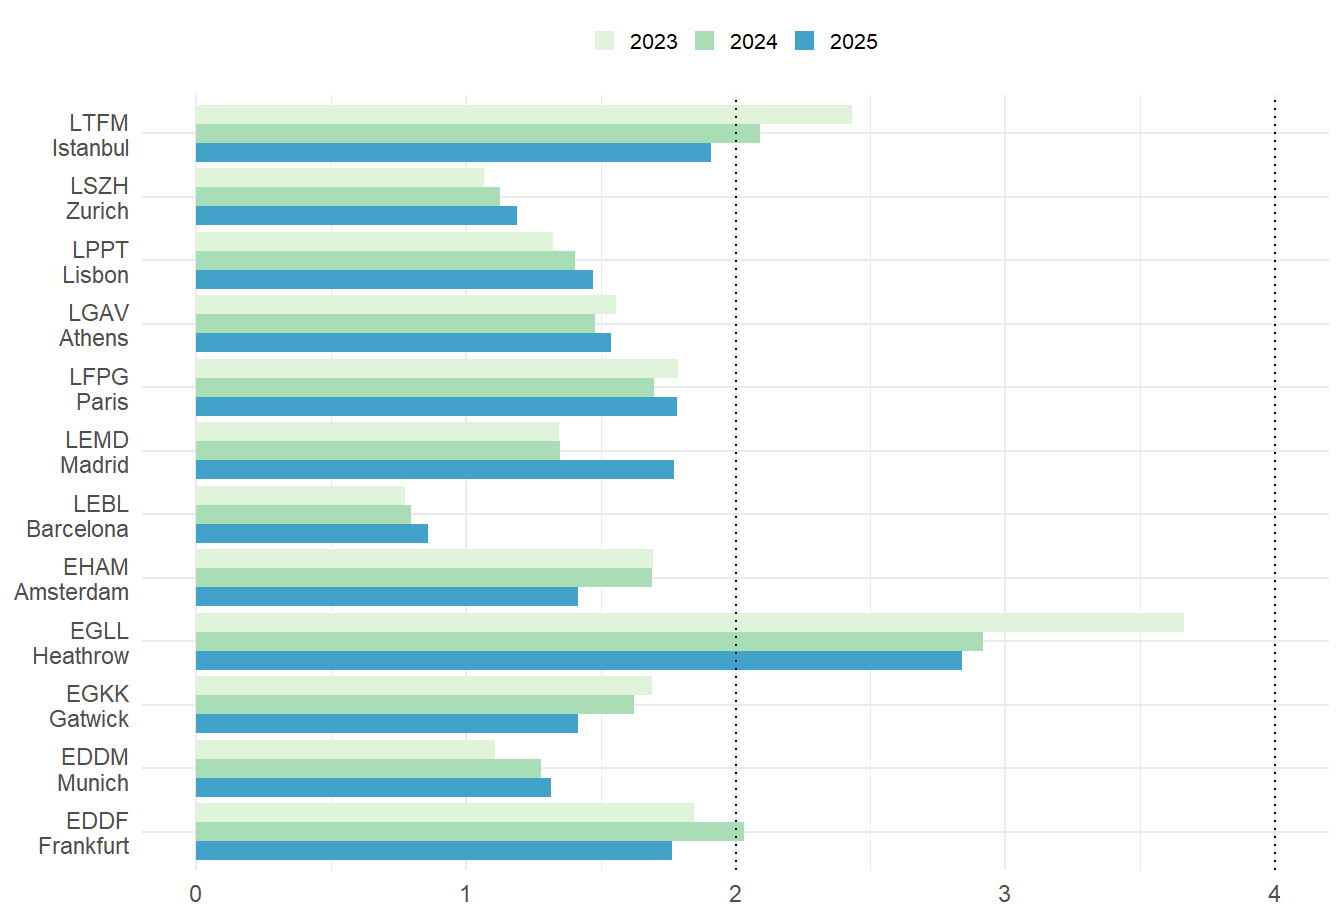
The annual development of the average additional taxi-in times at the study airports is depicted by Figure 6.1 and Figure 6.2. The 2-minute threshold per arrival continues to serve as a practical reference point for evaluating taxi-in efficiency. This report expands the Brazilian and European airport set to 12 airports: for Brazil, the new entries are Recife (SBRF) and Eduardo Gomes/Manaus (SBEG), and for Europe, Athens (LGAV) and Istanbul (LTFM).
6.1.2 Monthly Variation of Additional Taxi-in Times
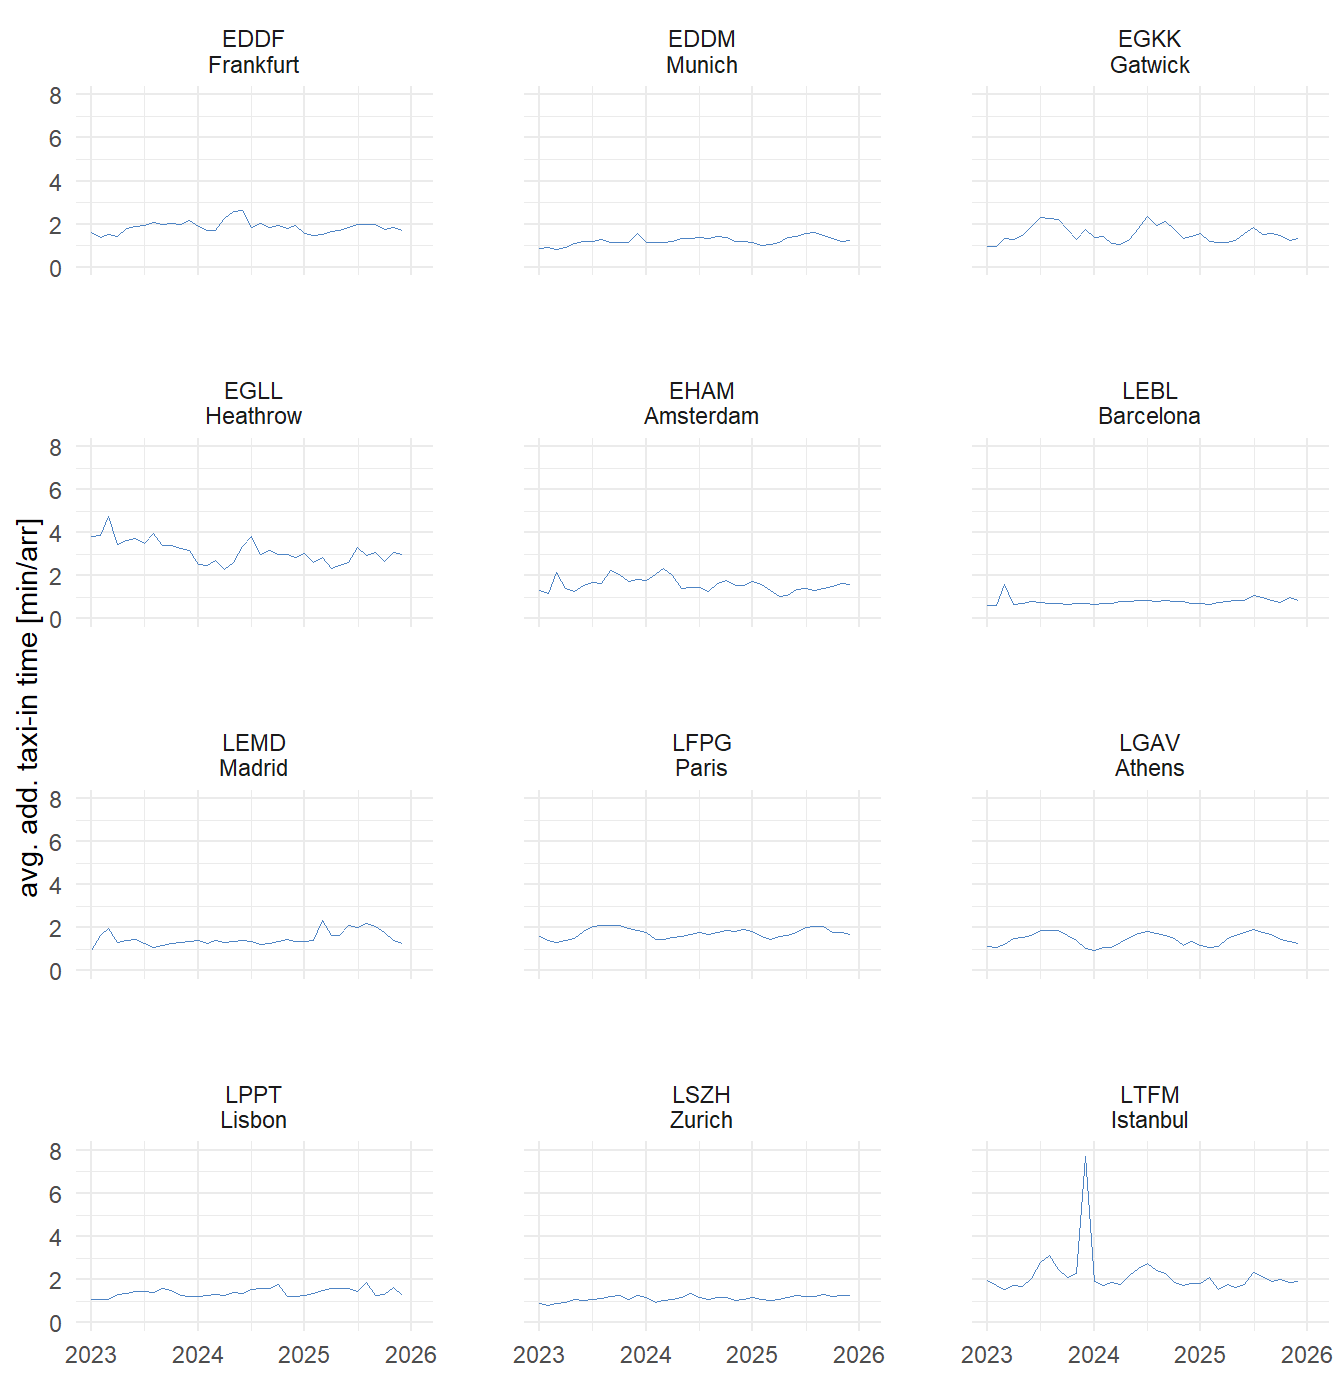
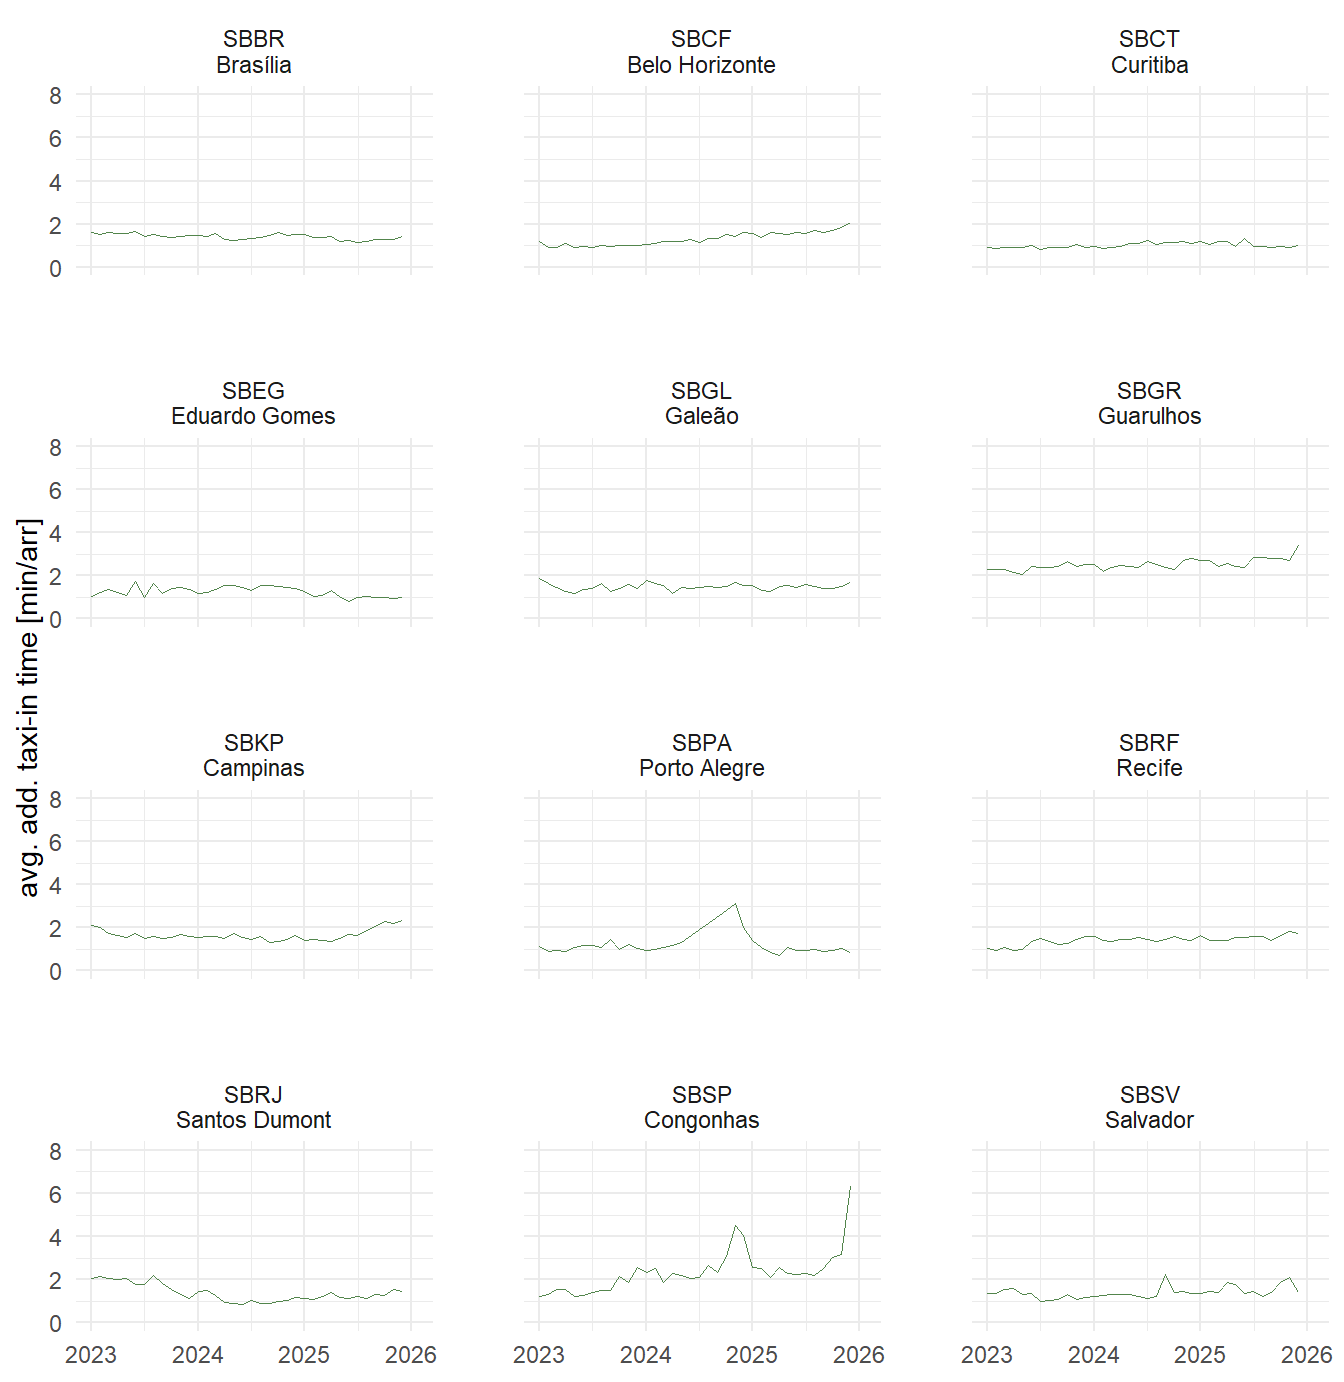
The evolution of the taxi-in time at the study airports, shown in Figure 6.3 and Figure 6.4, reinforces the annual comparison and provides a check on the seasonal variation of the surface movement indicator.
6.2 Taxi-Out Times
6.2.1 Annual Evolution of Additional Taxi-out Times
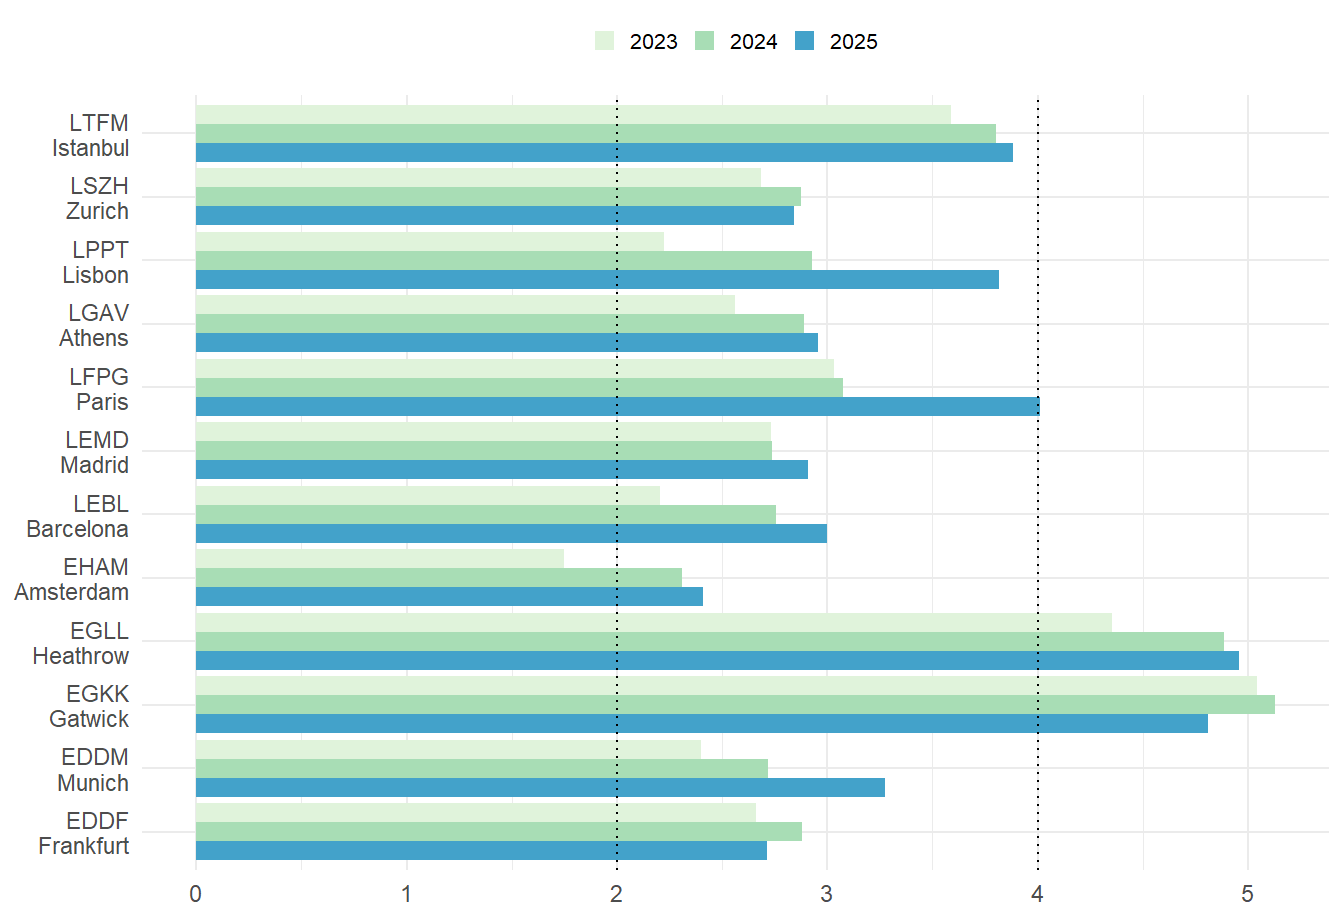
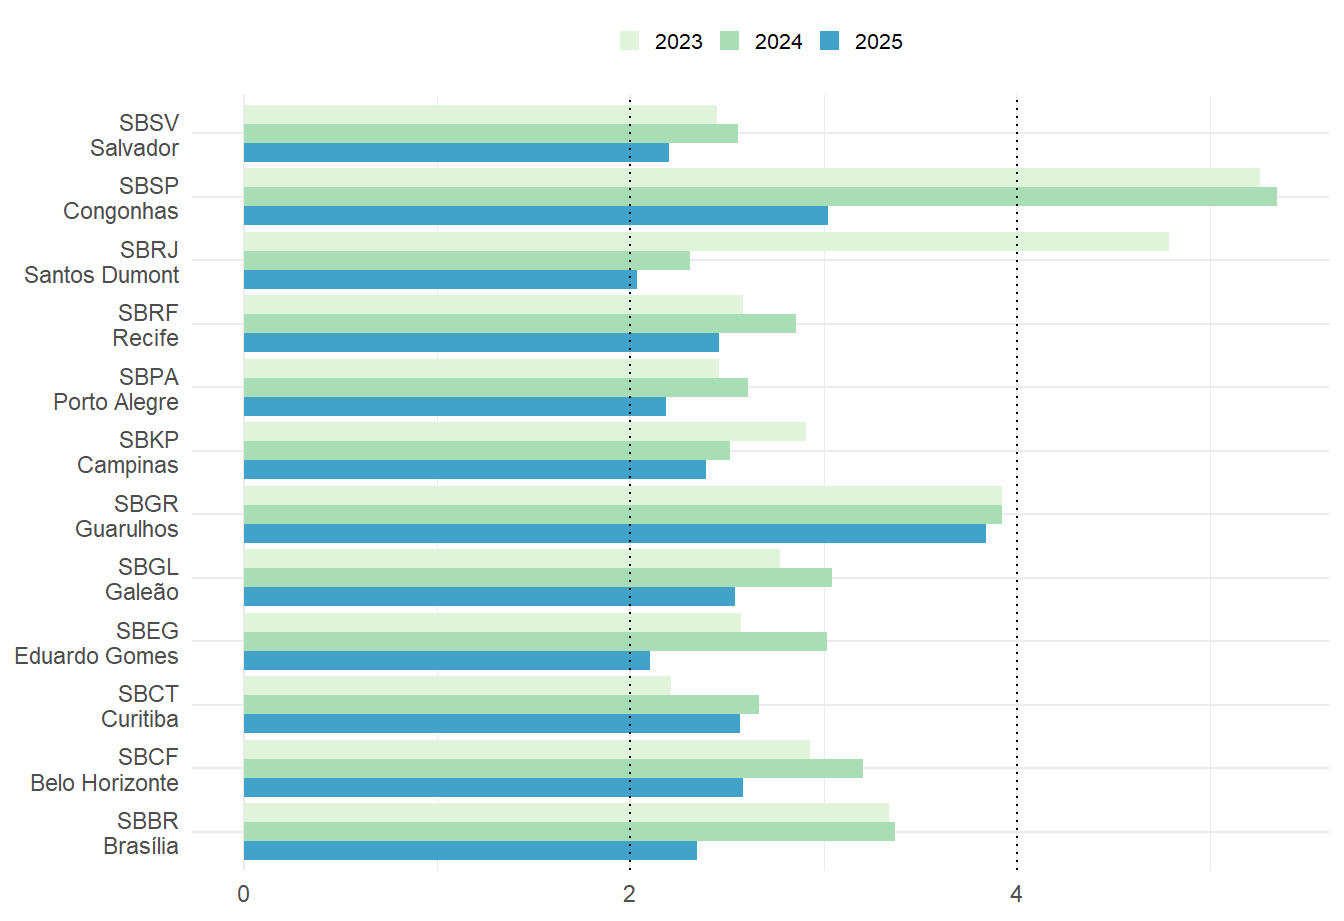
On average, higher additional times for taxi-out are observed across airports (see Figure 6.5 and Figure 6.6). The taxi-out phase requires a higher level of management of the surface movements. Departure procedures and flow control can impact the departure queue.
6.2.2 Monthly Variation of Additional Taxi-out Times
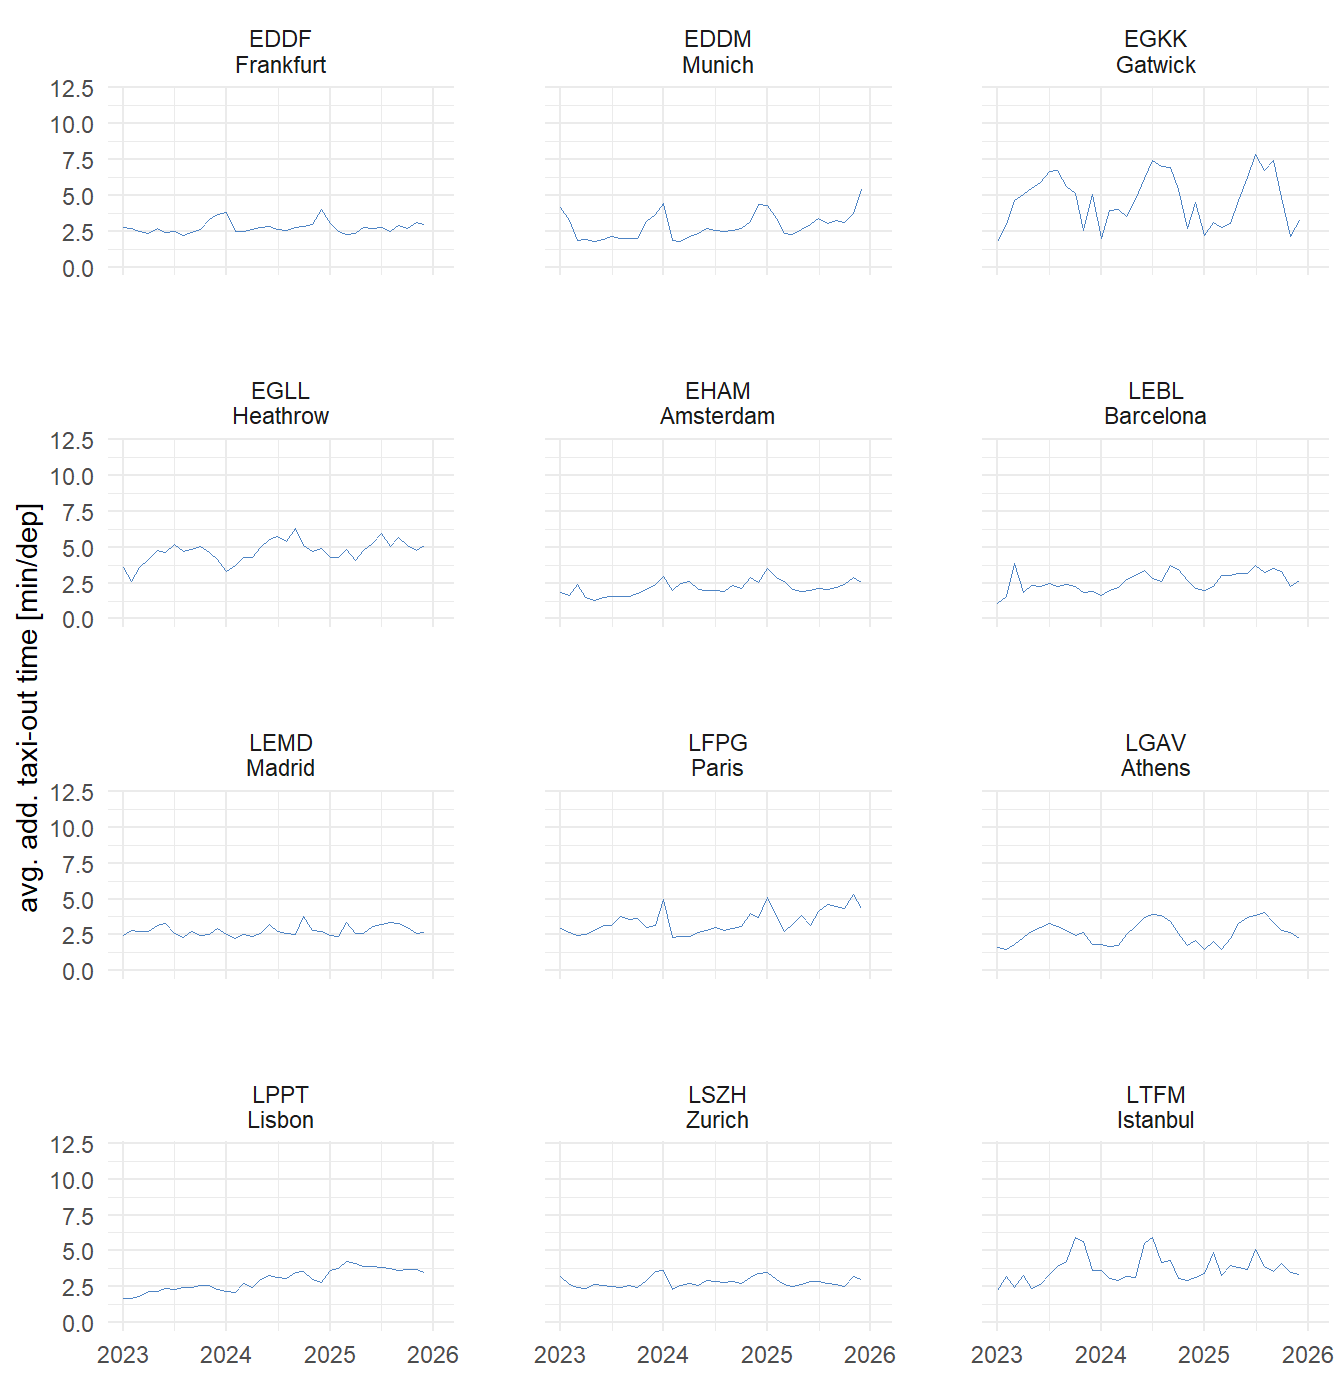
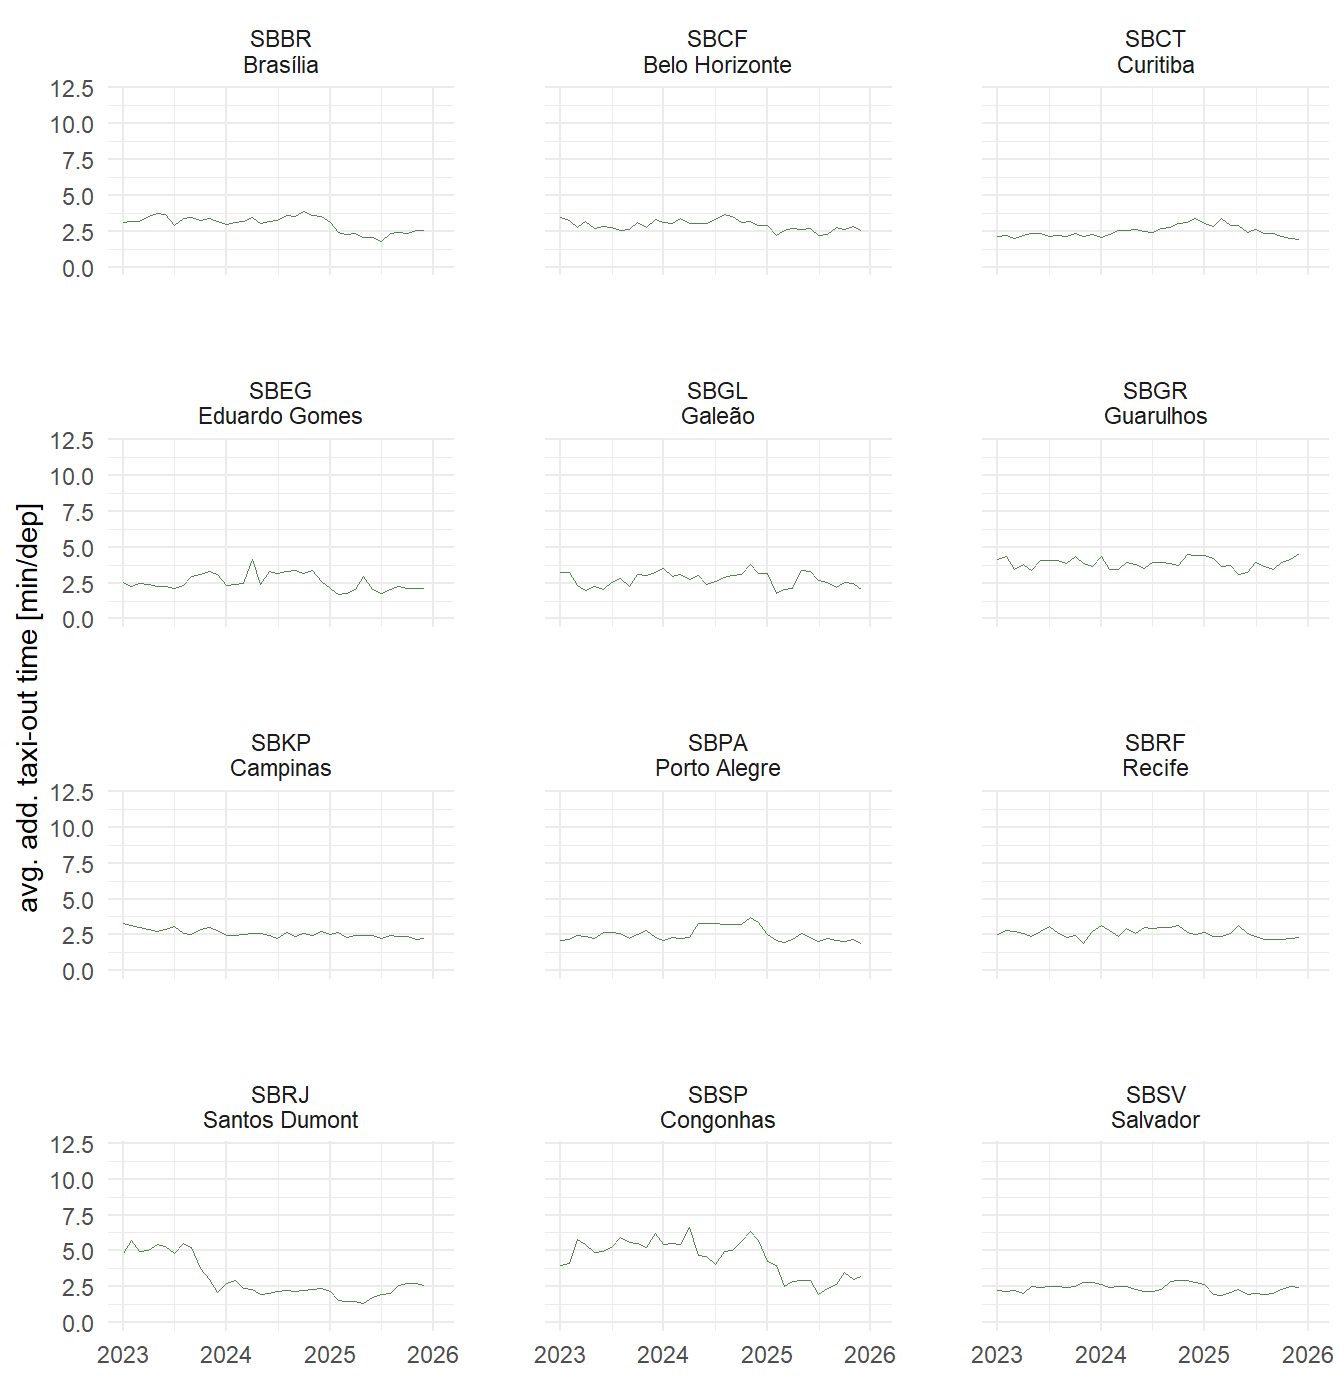
The monthly evolution in Figure 6.7 and Figure 6.8 complements the annual comparison and highlights seasonal variation in the additional taxi-out times.
6.3 Mapping Additional Taxi-in and Taxi-out Times
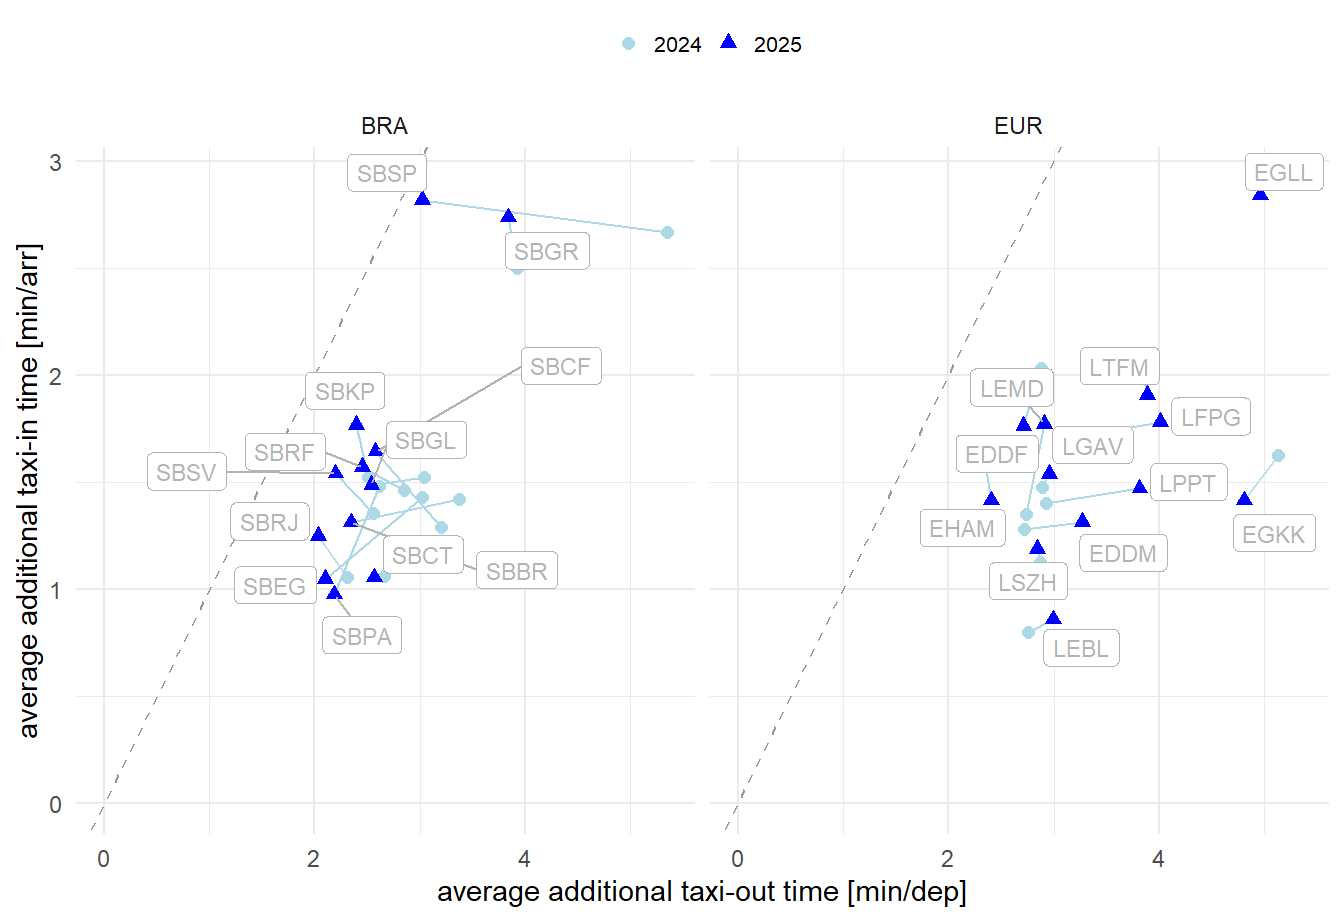
This analysis builds on the previous sections. Figure 6.9 compares the relationship between the taxi-in and taxi-out performance observed at the study airports. It also shows that on average taxi-out operations accrue more additional time than taxi-in operations.
6.4 Additional Time in Terminal Airspace
The additional time in terminal airspace is calculated as the difference between the actual flying time from entering the sequencing area and a reference time for comparable arrivals. Previous research and guidance suggest that the reference time can be built for flights sharing similar operational characteristics.
The ASMA data for both regions are being further harmonised and follow the ICAO GANP 20th percentile approach for determining reference times. For Brazil, the refreshed data preparation now supports both 40 NM and 100 NM arrival sequencing areas for 2023-2025. For Europe, the ASMA comparison is extended to cover both ranges while the harmonised ASMA preparation is being aligned with the Brazilian update.
6.4.1 Additional ASMA Time at 40 NM
The 40 NM view gives a closer-in terminal-airspace perspective. For this report, this range is available for Brazil and provides an additional view on the terminal arrival segment closer to the aerodrome.
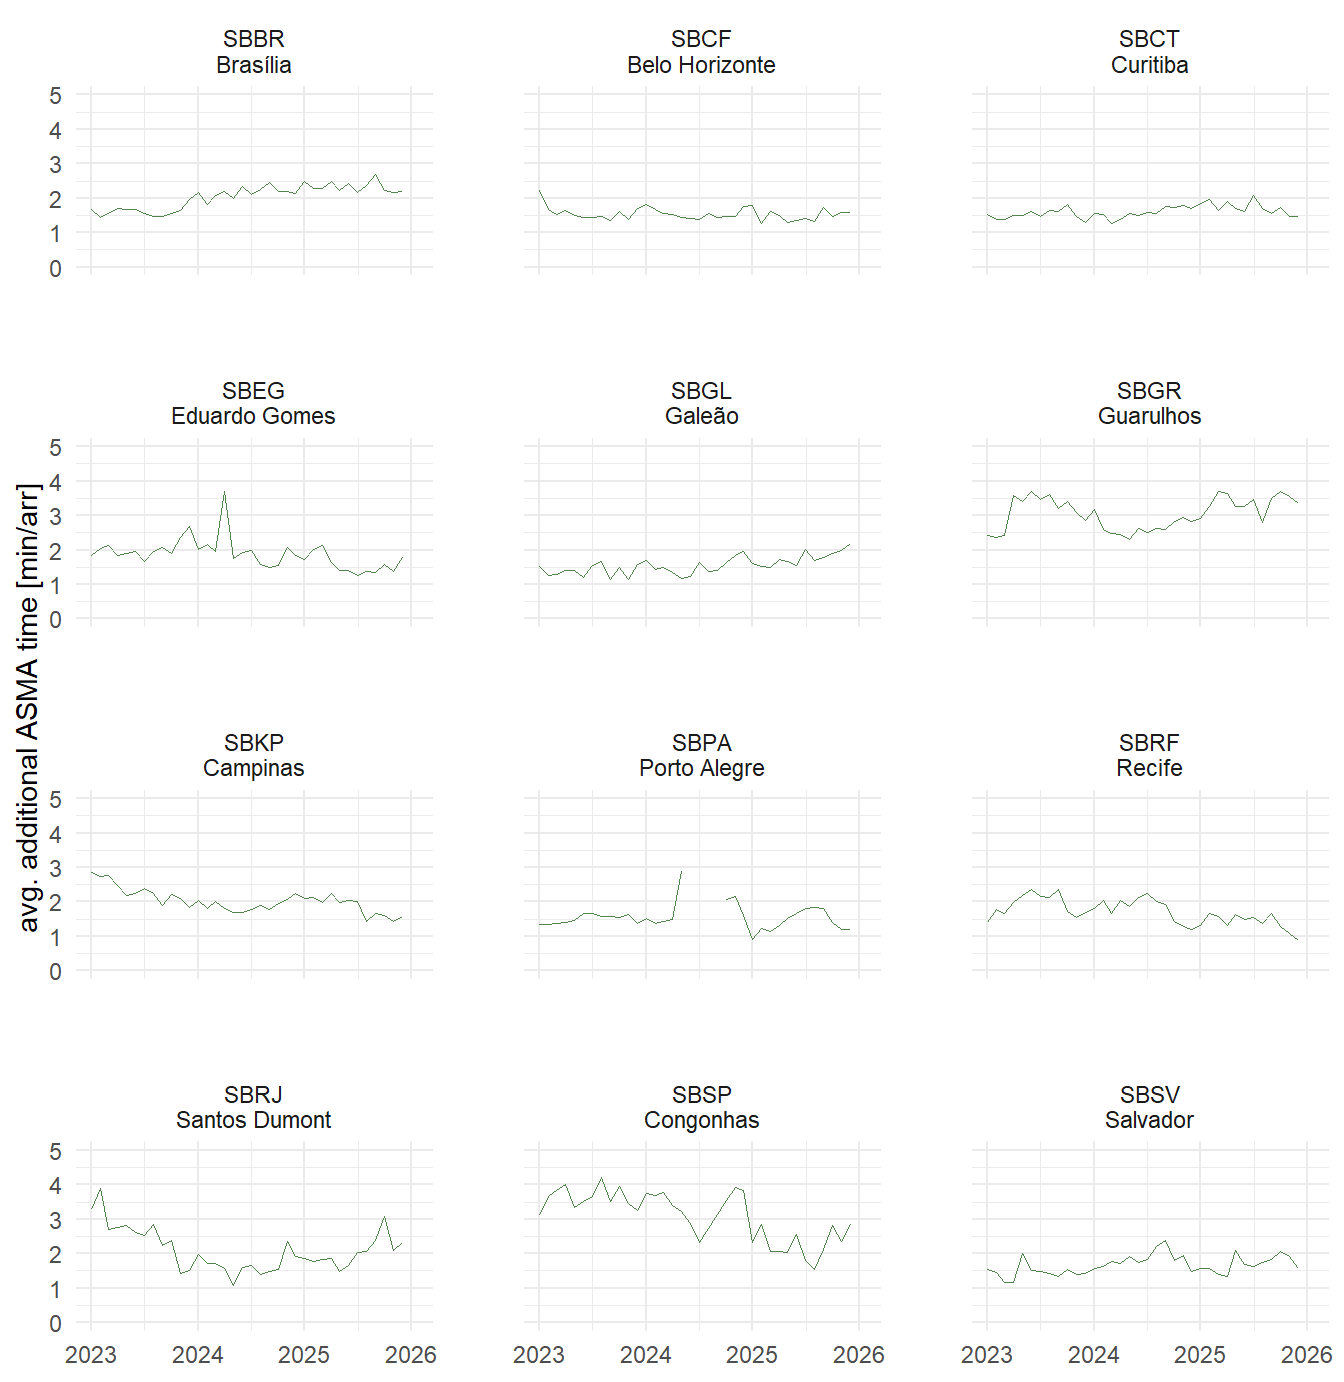
The 40 NM results in Figure 6.10, Figure 6.11, Figure 6.12, and Figure 6.13 provide the closer-in view of arrival sequencing. For Brazil, the 40 NM results are lower than the 100 NM values, as expected for the shorter arrival segment. At the Brazil regional level, the 40 NM average remains close to 2.2 minutes per arrival in 2024 and 2025. The monthly timeline shows that the closer-in ASMA measure still varies across the study airports and across the year.
6.4.2 Additional ASMA Time at 100 NM
The 100 NM measure remains the headline indicator for additional time in terminal airspace. It captures the longer arrival sequencing horizon and is most comparable to the historical ASMA/KPI08 presentation in previous BRA-EUR reports.
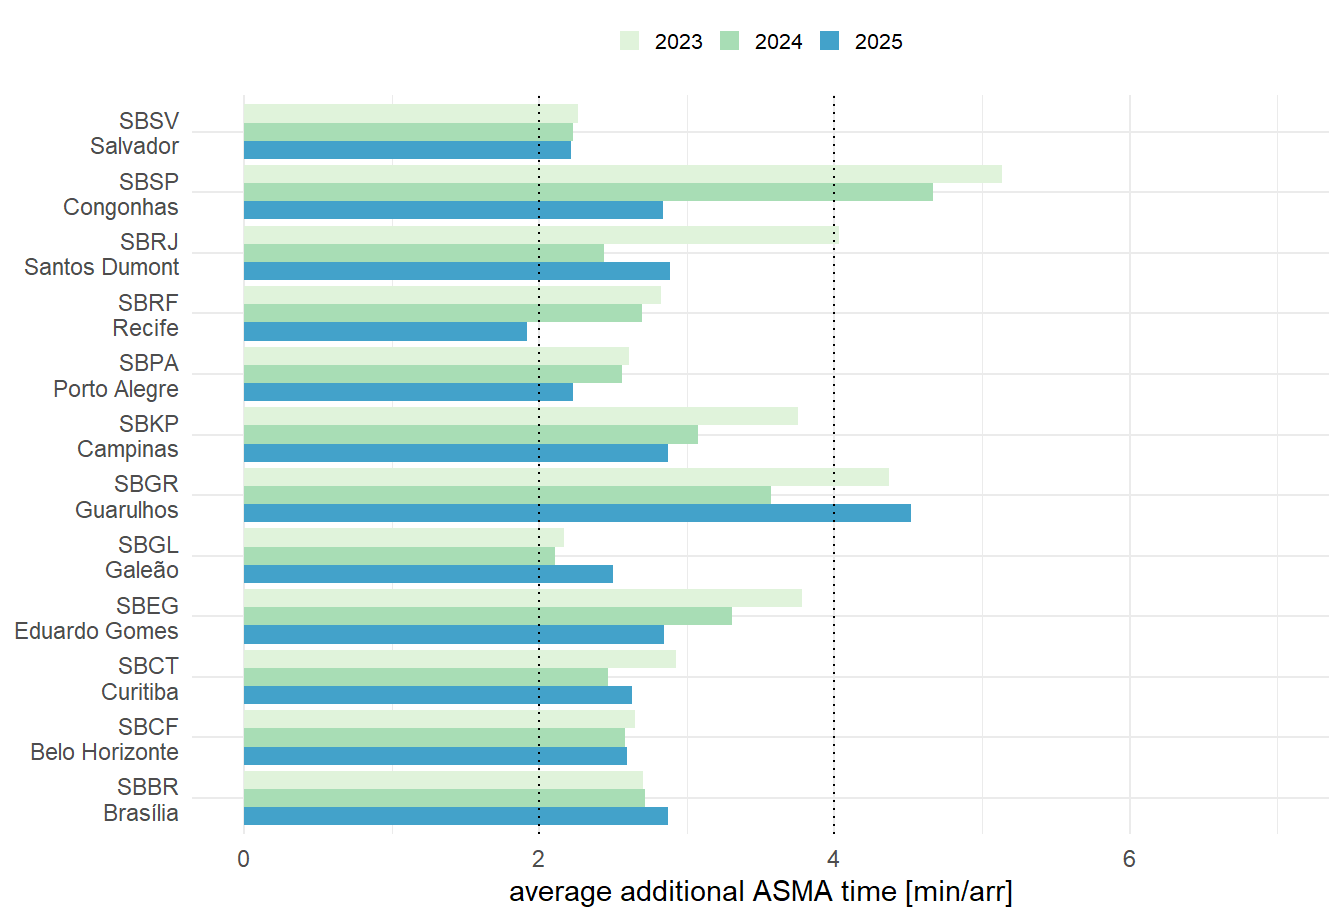
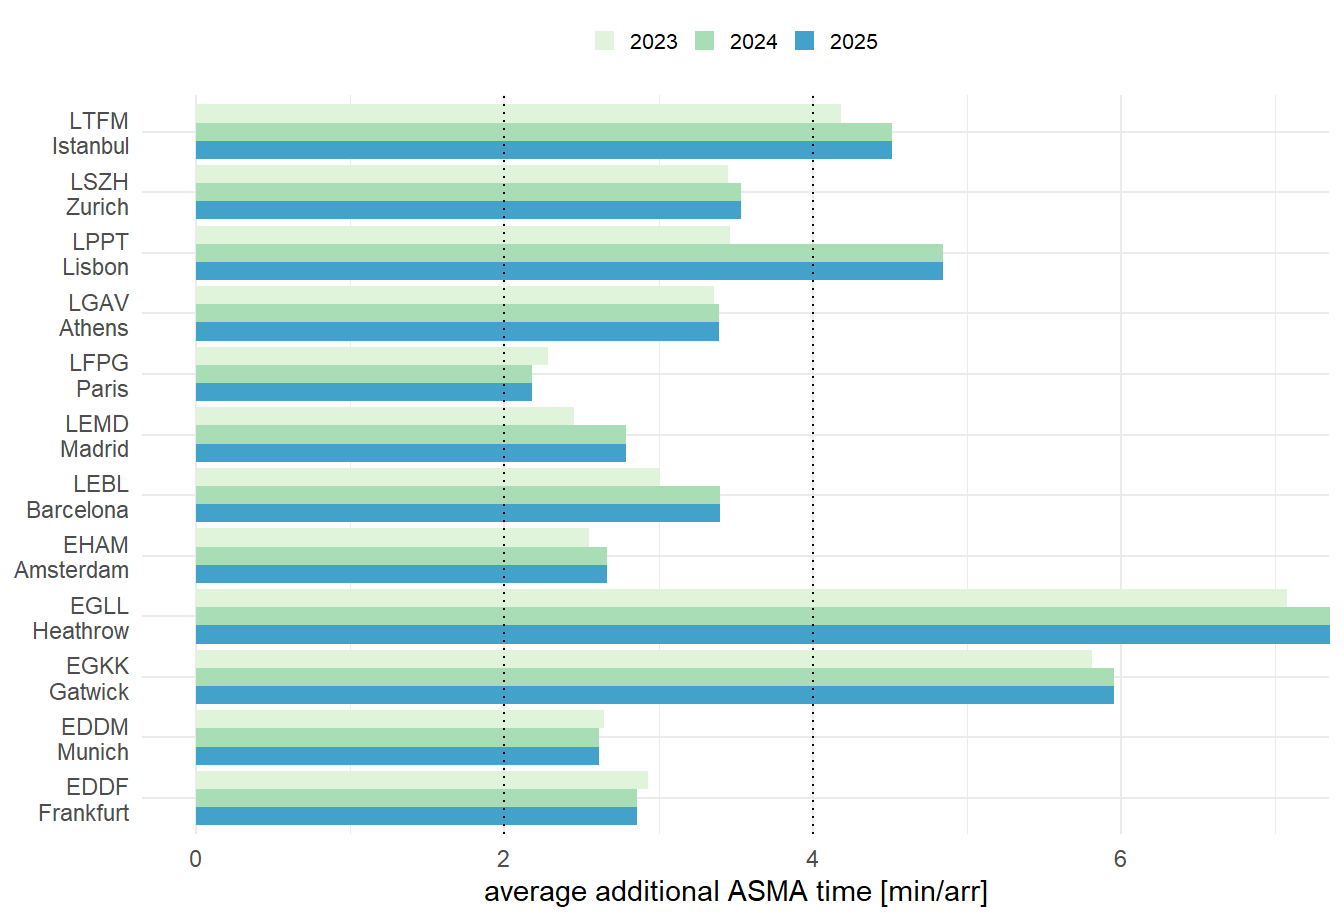
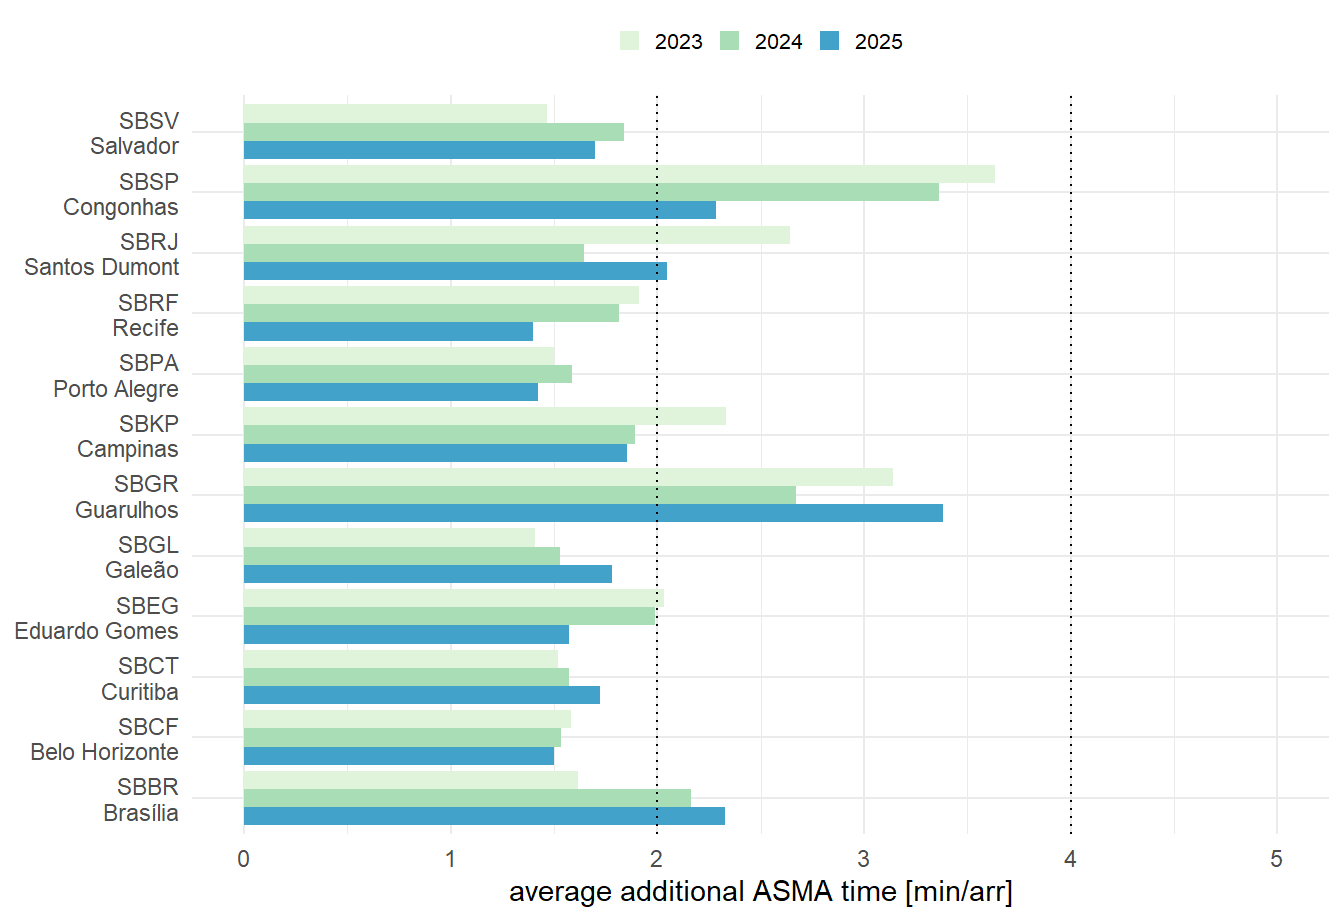
Figure 6.14 shows a gradual improvement in the Brazil weighted average at 100 NM, from about 3.6 minutes per arrival in 2023 to about 3.0 minutes in 2025. The highest additional times remain concentrated at the larger and more constrained arrival systems. Congonhas (SBSP) improves materially in 2025, while Guarulhos (SBGR) increases again and remains the highest Brazilian airport in the 2025 sample.
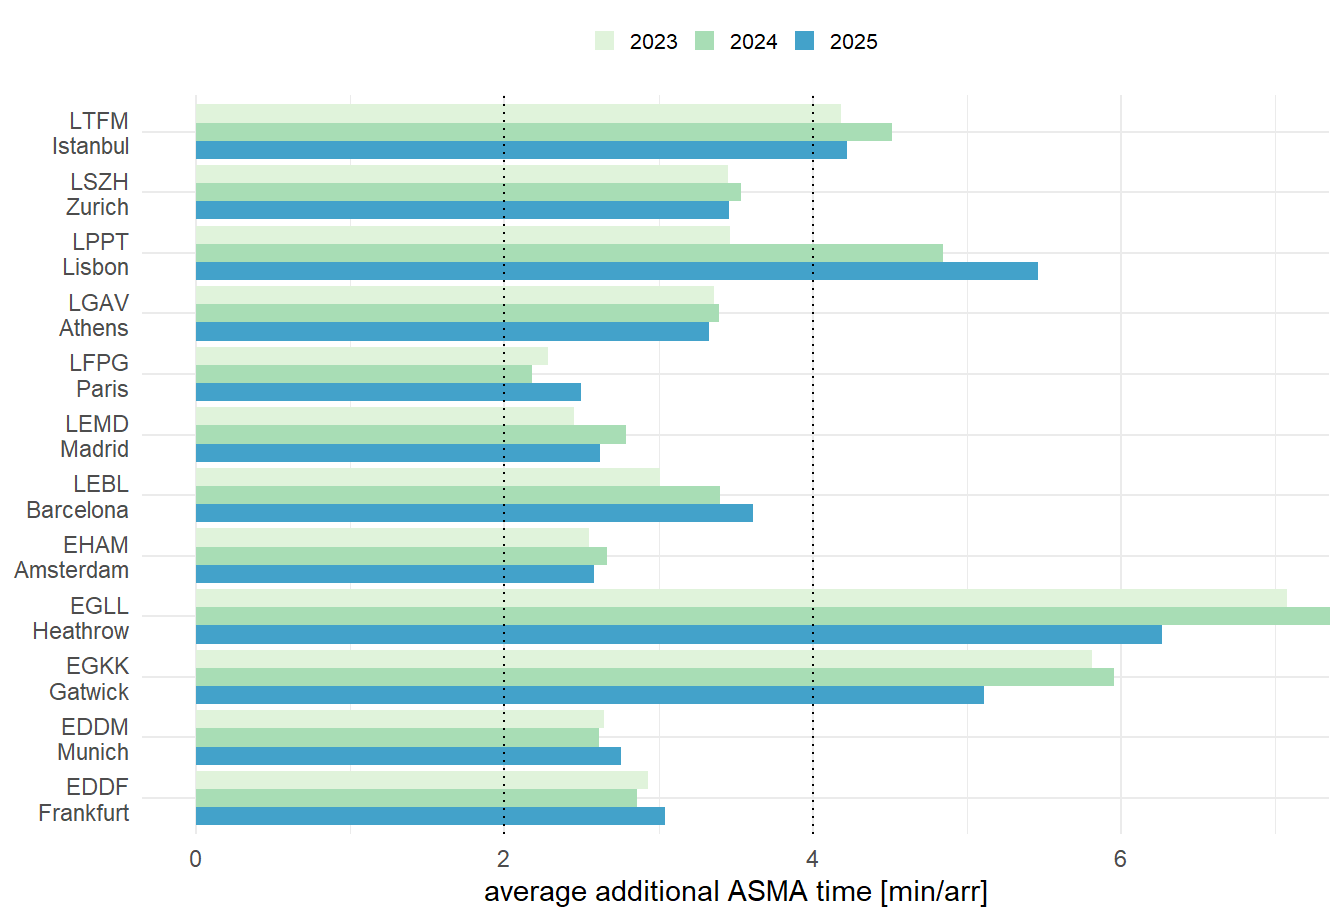
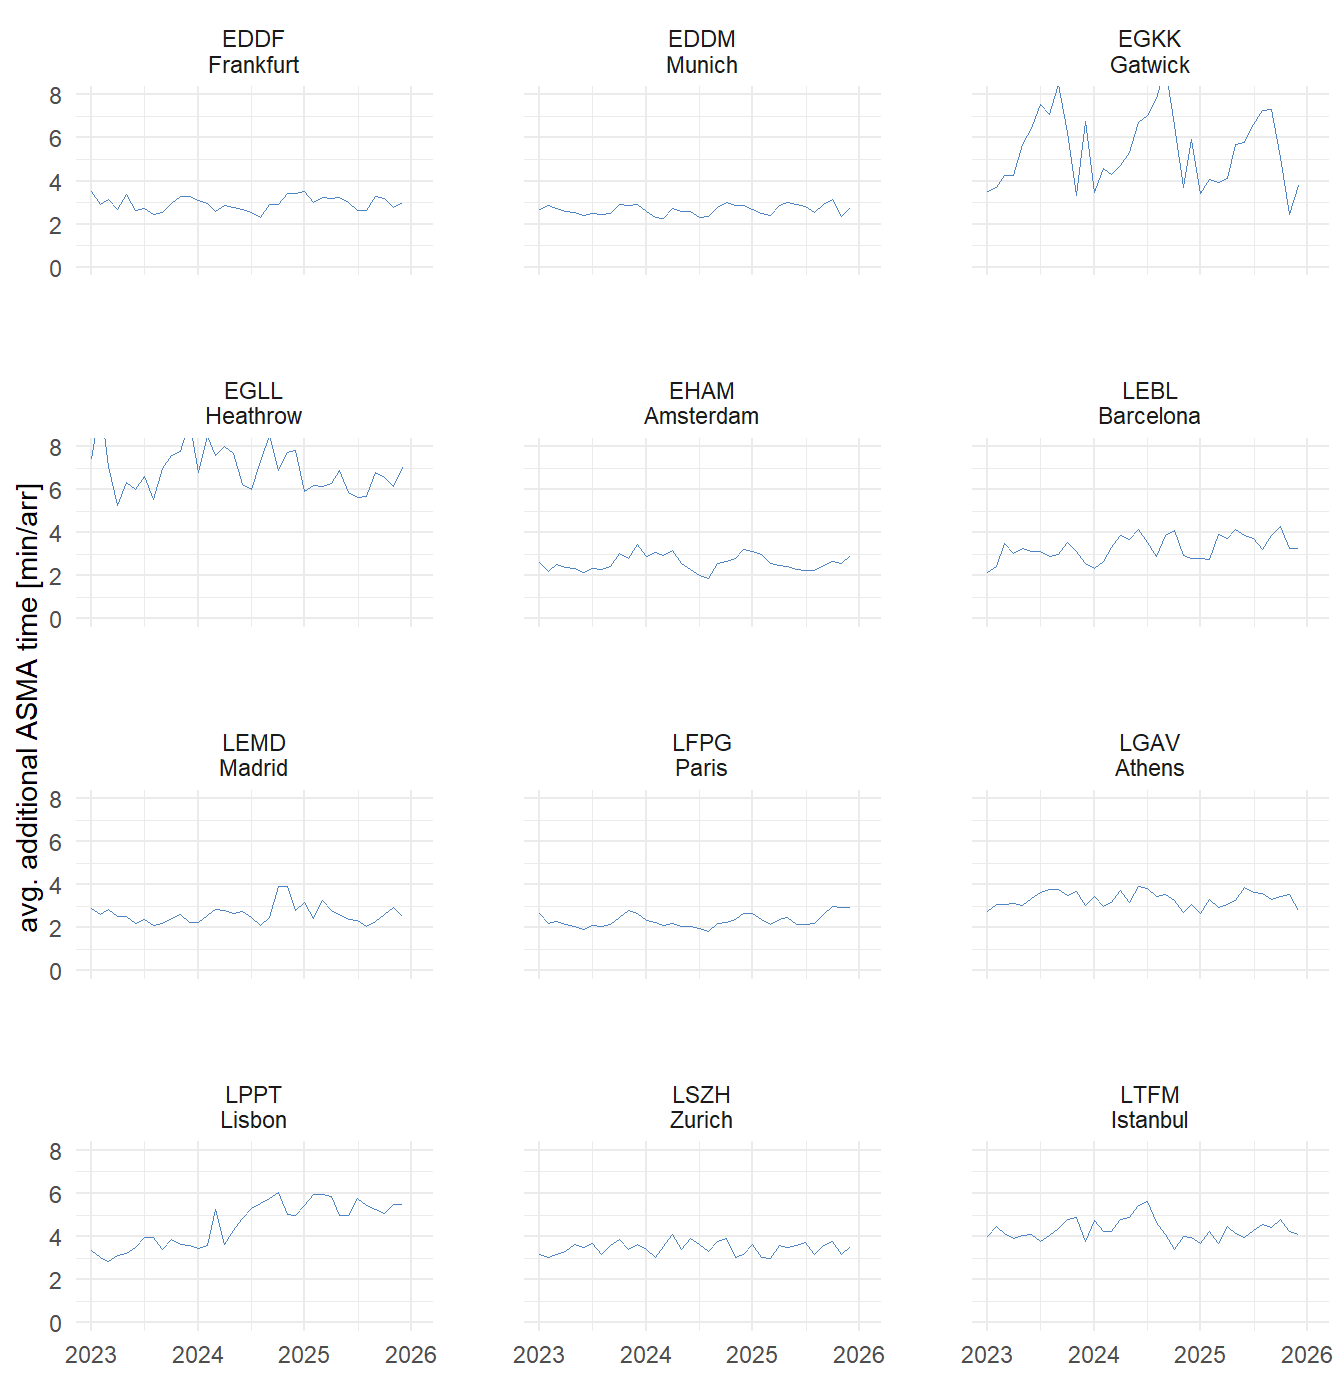
Figure 6.15 keeps the European comparison visible at the established 100 NM range. The European regional average remains close to 3.6-3.8 minutes per arrival over the 2023-2025 period.
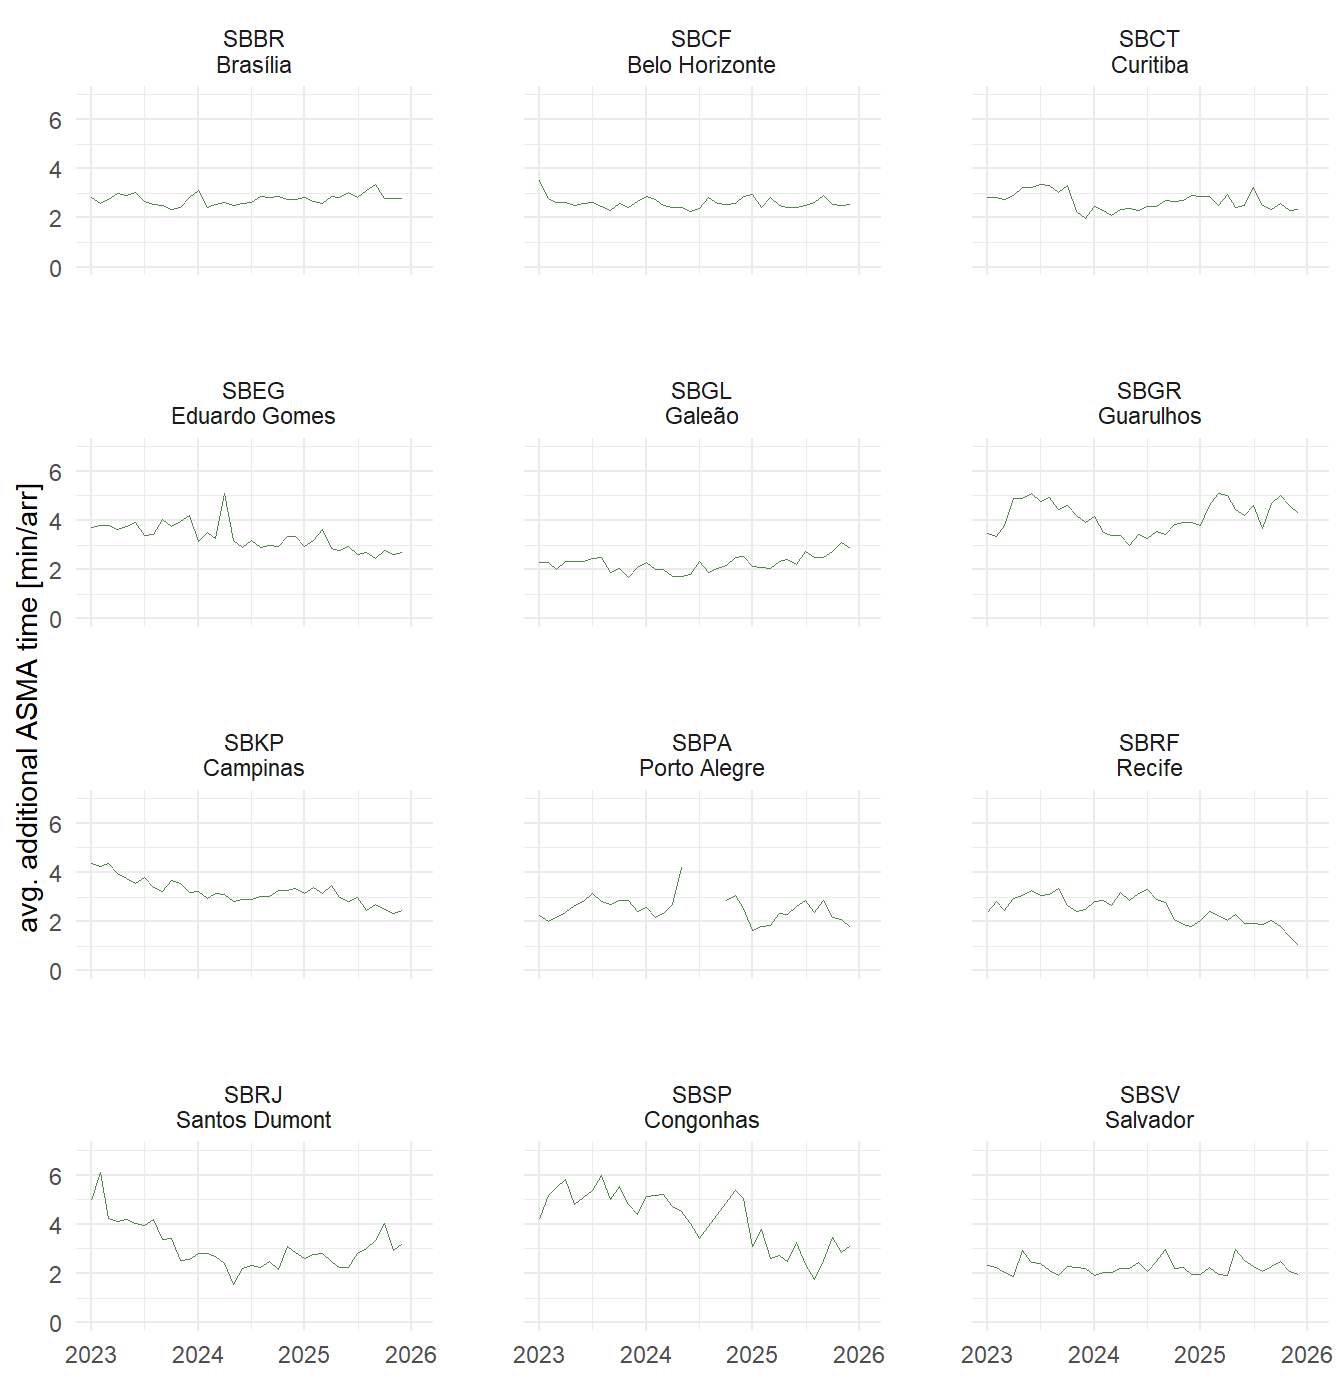
The monthly 100 NM timeline in Figure 6.16 provides the multi-year view for the Brazil arrivals. It shows that the annual averages mask substantial month-to-month variation, especially at Congonhas (SBSP), Santos Dumont (SBRJ), Guarulhos (SBGR), and Eduardo Gomes (SBEG). This makes the ASMA output useful beyond the annual indicator because the same approach can support follow-up checks for airport-level operational patterns.
6.4.3 Comparison by ASMA Range
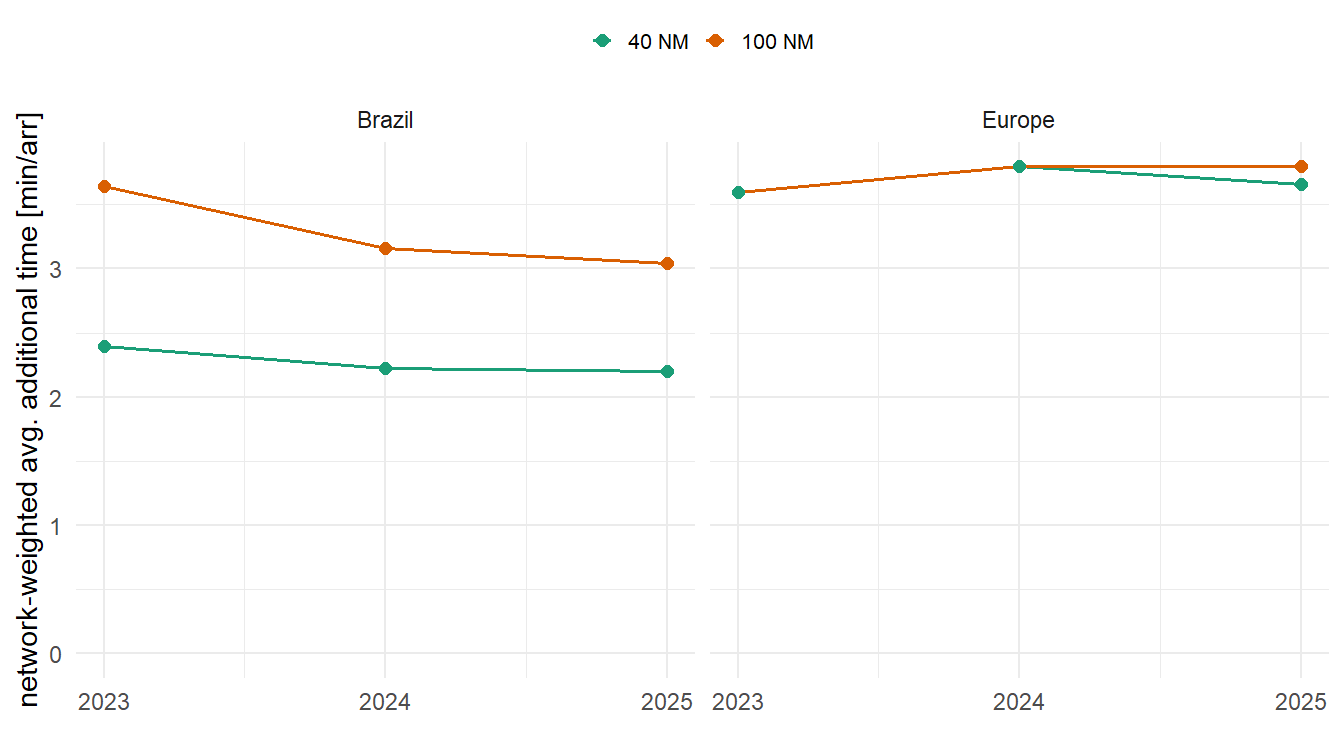
Figure 6.17 compares the regional averages for the available ASMA ranges. For Brazil, the 100 NM average remains higher than the 40 NM average, which indicates that a meaningful share of the additional time is accrued before aircraft enter the closer-in 40 NM area. At 40 NM, the European regional average remains higher than the Brazilian regional average over the 2023-2025 period. At 100 NM, Brazil and Europe are within the same order of magnitude over the 2023-2025 period. The Brazilian 100 NM values show a gradual reduction, while the European 100 NM values and the 40 NM values in both regions remain comparatively stable in this comparison report.
6.5 Summary
This chapter analysed operational efficiency through the assessment of additional taxi-in, taxi-out, and terminal-airspace ASMA times. The 2025 update extends the comparison for the selected study airports and applies the ICAO GANP 20th percentile approach to the harmonised taxi-time indicators for both regions.
For taxi-in, the 2-minute threshold per arrival remains a useful practical reference point. The annual and monthly views indicate that taxi-in additional times remain generally contained, while constrained airport systems continue to show higher values. For taxi-out, additional times are higher than for taxi-in, reflecting the operational complexity of departure sequencing, surface movement management, and flow restrictions.
The ASMA section provides a first harmonised view of additional time in terminal airspace for both regions at 40 NM and 100 NM. The 40 NM values are lower, as expected for the closer-in arrival segment, while the 100 NM values capture a wider share of arrival sequencing and terminal airspace management. At 40 NM, the European regional average remains higher than the Brazilian regional average, while at 100 NM both regions are within the same order of magnitude in this comparison. Further harmonisation of the ASMA data will support a more robust side-by-side interpretation in future updates.