4 Predictability
The preceding sections have demonstrated that both air navigation systems exhibit unique reactions to the broader developments in air transport. Predictability plays a crucial role in these systems, impacting their functioning during both the strategic phase, where airline schedules are formulated, and the operational phase, where Air Navigation Service Providers (ANSPs) and stakeholders manage the delicate balance between demand and capacity. Enhanced predictability stands to be advantageous for ANSPs, mainly when serving airspace users, as it contributes to highly efficient operations, even during periods of peak demand. This chapter focuses on arrival and departure punctuality observed at the study airports as a driving factor for predictability.
4.1 Arrival Punctuality
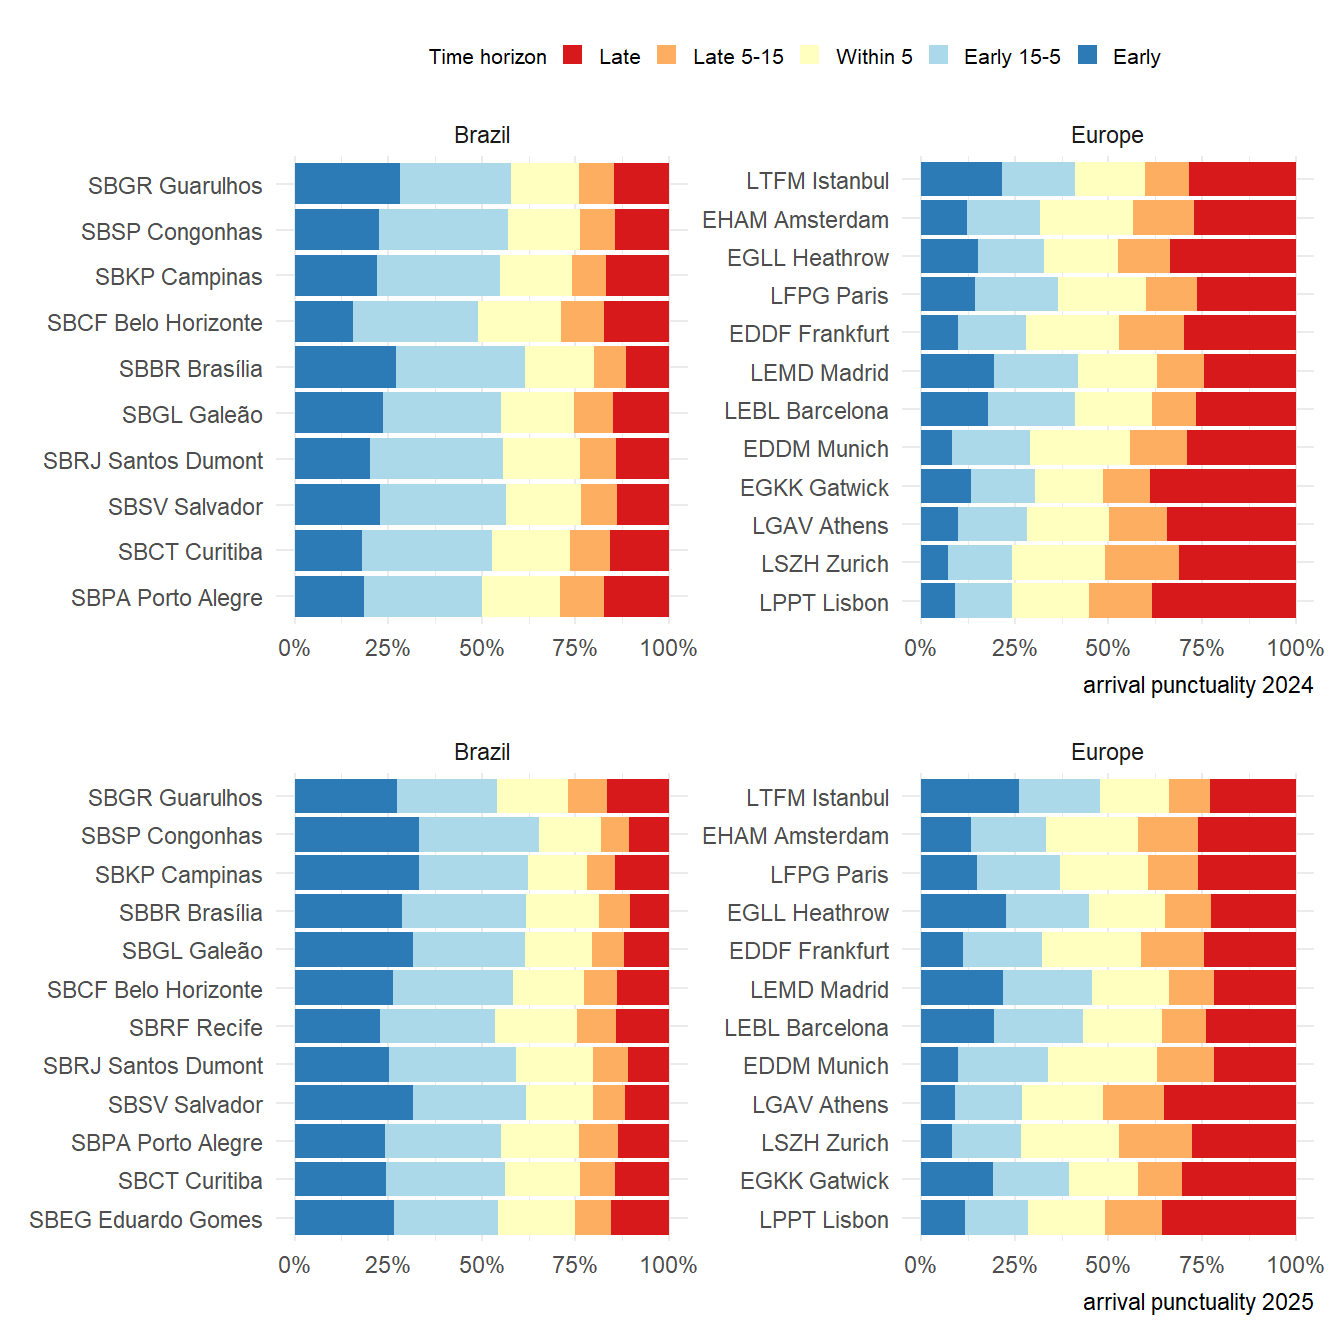
The arrival punctuality shows the predictability of landing operations at airports, based on the scheduled in-block time (SIBT). It considers a 15-minute window for early or late arrivals and expresses the percentage of flights arriving at the gate within that margin.
Figure 4.1 shows the 2025 data and reaffirms key structural differences in punctuality behaviour between Brazilian and European airports. Brazilian airports continue to report a high share of early arrivals, with 29% of flights arriving more than 15 minutes ahead of schedule across the study airports. This represents an increase from 23% in 2024 and reinforces the schedule-buffering point. In contrast, early arrivals accounted for 16% of European arrivals. This pattern, observed consistently over recent years, reflects the use of built-in buffer times in Brazil’s scheduling practices. While these buffers help airlines improve on-time performance records, they can reduce predictability and complicate planning for air traffic management and airport operations.
Compared to Brazil, Europe observed a high level of delayed arrivals in 2025 (c.f. Figure 4.1). Across the European study airports, 26% of arrivals were more than 15 minutes late. This nevertheless marks an improvement against 2024, when 30% of European arrivals were delayed by more than 15 minutes. The highest share was observed at LPPT, where 36% of arrivals were late. Capacity constraints on the European network level - amplified by local constraints - rippled throughout the whole network and contributed to the poor overall delay performance.
Across both regions, the share of flights arriving within the -/+ 15 minute window remains the key measure of operational predictability. In 2025, 58% of Brazilian arrivals and 58% of European arrivals were within this interval. For Europe, this share increased from 56% in 2024.
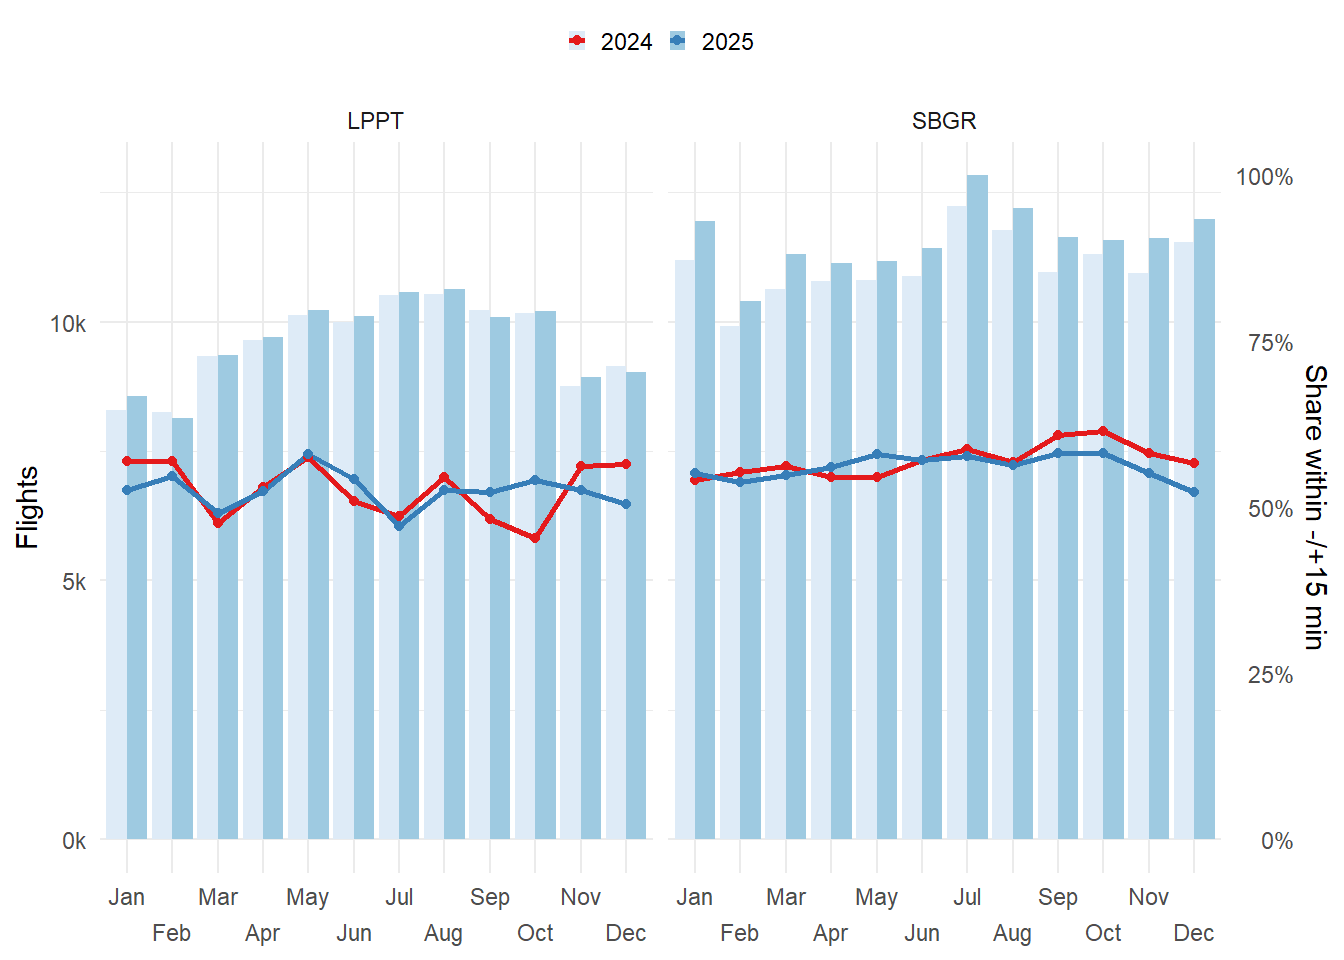
To contextualise regional contrasts, Figure 4.2 presents a side-by-side comparison between Guarulhos (SBGR) and Lisbon (LPPT) between 2024 and 2025. Despite LPPT handling less traffic compared to SBGR, it continued to show a lower share of arrivals within the -/+15 minute window. Compared to Figure 4.1 it is interesting to note - broadly assuming an average annual arrival punctuality of 50% of flights arriving between -/+15 minutes of their scheduled time - that the share of early and late arrivals is more balanced at SBGR, while LPPT observed a high share of late arrivals.
This comparison underscores how operational structure, traffic complexity, and scheduling strategies directly influence punctuality outcomes. In Brazil, concentrated demand at a few major hubs - especially SBGR, the country’s busiest airport - makes it harder to sustain performance within the target window. The higher level of traffic can amplify network disruptions leading to a high share of delay across all airports and ripple effects propagate through the network.
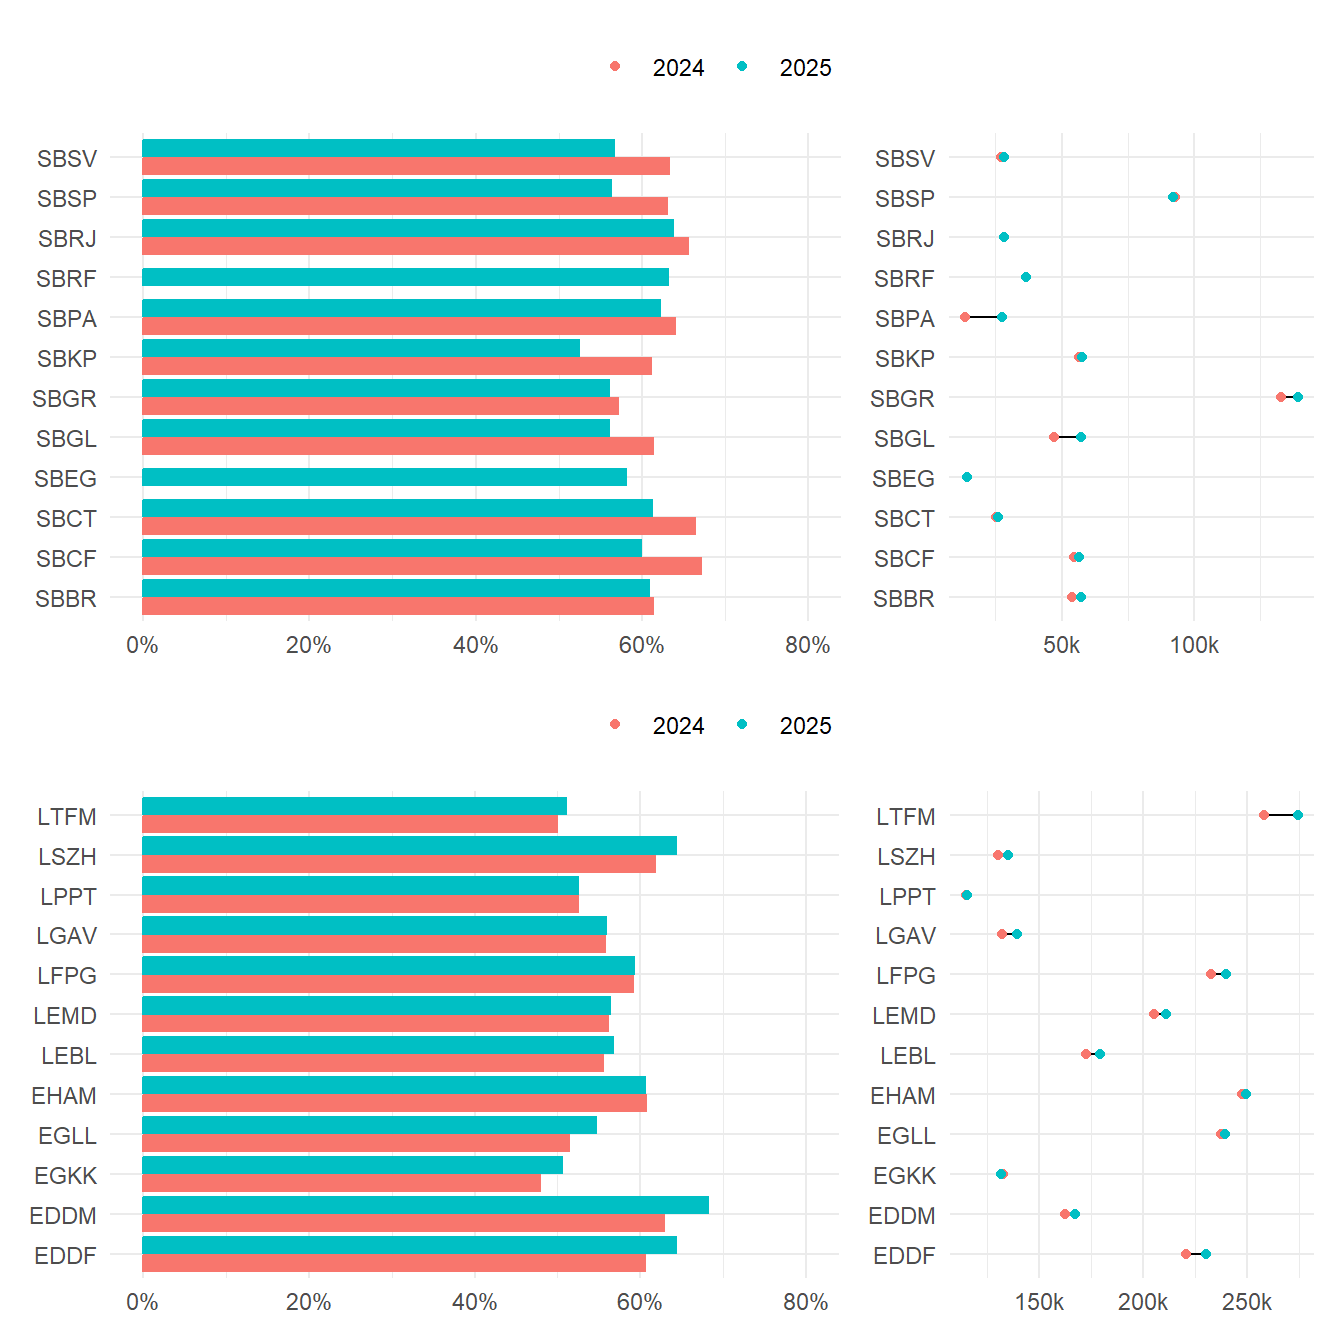
Figure 4.3 presents a side-by-side view of airport-level arrival punctuality and movement evolution between 2024 and 2025. While differences exist in the share of early and late arrivals, the number of flights arriving within -/+15 minutes of their scheduled time ranged higher in Brazil than in Europe. The majority of European arrival operations at the study airports failed to meet a 60% threshold. This is contrasted by the higher success rate observed across the Brazilian study airports, though the high early-arrival shares show that predictability still differs from punctuality as perceived by passengers.
The previous section highlighted the overall arrival punctuality observed at the study airports. Lower levels of punctuality can negatively impact predictability of operations and thus put a stronger strain on resources managing the arrival flow. Next to the arrival airspace capacity, stronger variations of the scheduled arrival times pose challenges for the surface management, as taxi operations, including stand allocation and availability, might result in changes of the taxi patterns, queuing within the taxiway and apron/stand system.
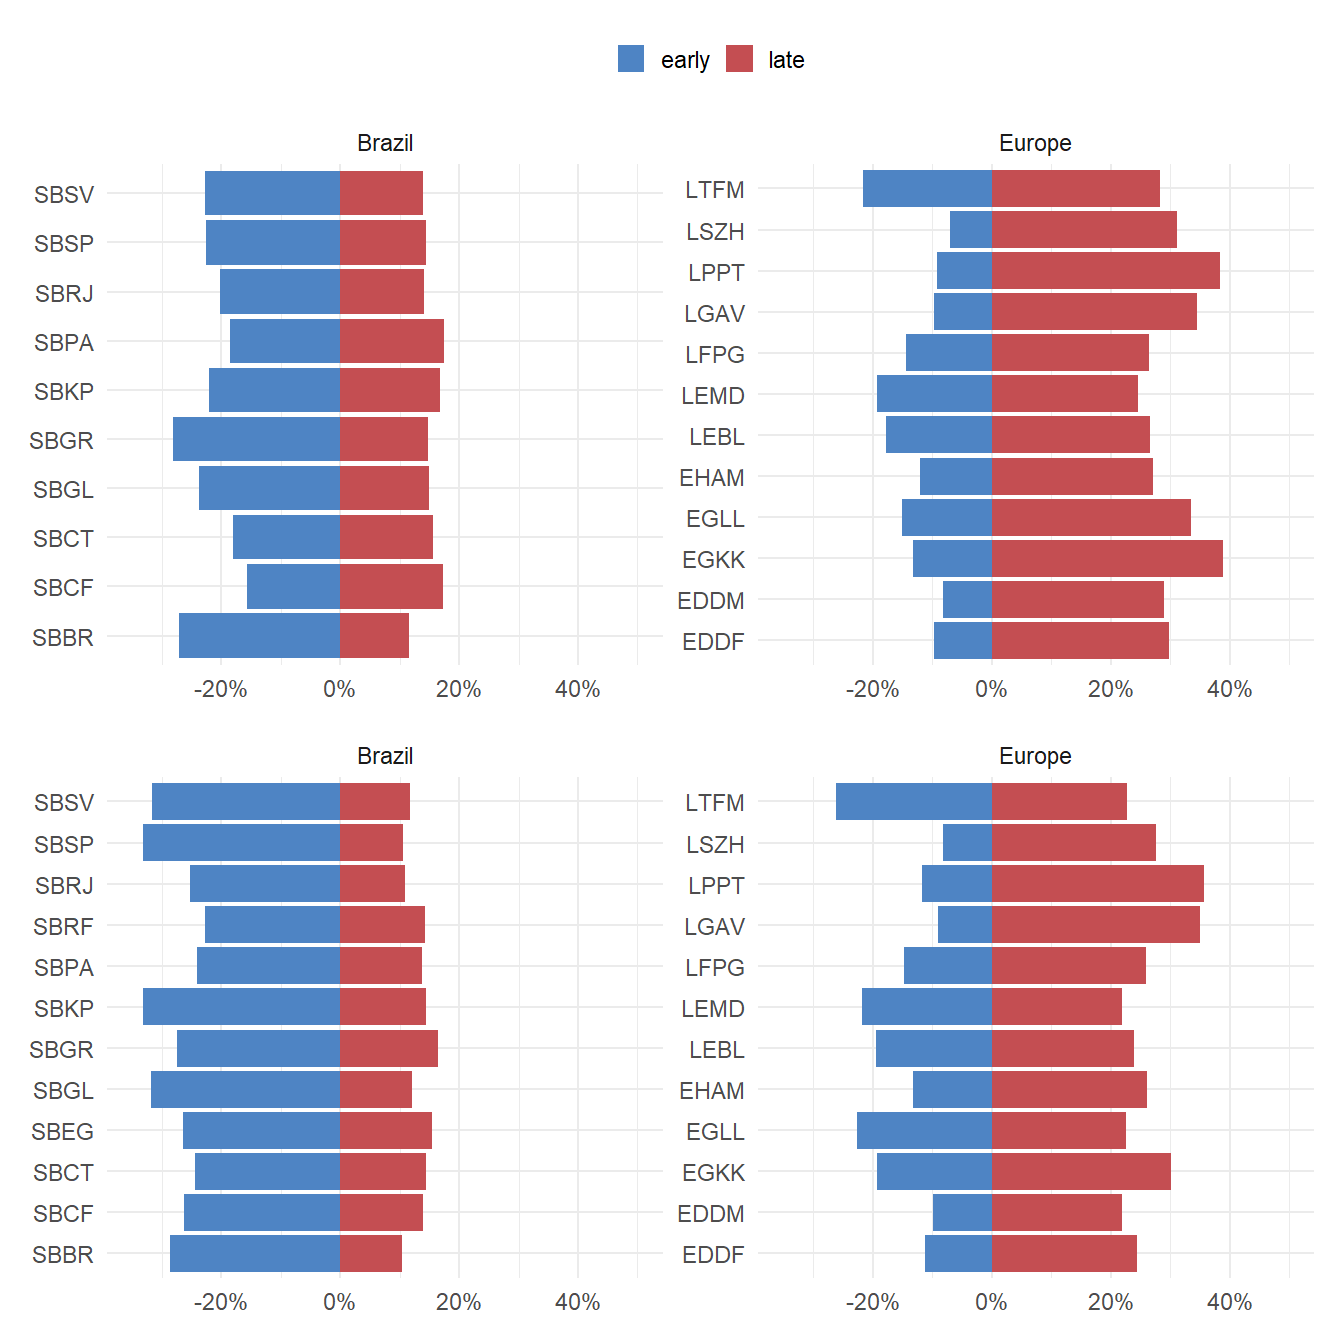
Figure 4.4 compares the share of early and late arrivals at each study airport, considering arrivals more than 15 minutes ahead of or behind schedule in 2024 and 2025. From a broader perspective, air traffic in Brazil continues to show a tendency toward early arrivals, while in Europe, delayed arrivals are more prevalent. Thus, it appears that Brazilian operators tend to apply conservative buffering of their arrival schedules. The network level implications on the arrival punctuality in Europe throughout 2024 and 2025 can be clearly seen.
SBSP remained the Brazilian airport with the highest share of early arrivals in 2025, with 33% of flights landing ahead of schedule. As a key hub in Brazil’s network, this may reflect a deliberate strategy by airlines to better manage connections and mitigate delays within their own schedules. However, from a flow management perspective, this lack of precision poses operational challenges, as it complicates the allocation of resources and the sequencing of arrivals within controlled airspace and on the ground.
In Europe, delayed arrivals remain the dominant off-schedule pattern. There is a varied explanation of the overall poor arrival punctuality performance across the airports. It is important to understand that disruptions stemming from the transition from pandemic to post-pandemic, and the overall network capacity constraints amplified each other. Airport operators were identified as the major contributors to primary delays, followed by ATFM delays. However, the aforementioned reactionary effect was the main driver of knock-on delays (EUROCONTROL Central Office of Delay Analysis 2023) 1.
4.2 Departure Punctuality
The departure punctuality reflects the predictability of take-off operations at monitored airports. It is based on the comparison between the scheduled off-block time (SOBT) and the actual off-block time (AOBT), using a 15-minute tolerance window for early or late departures. The indicator expresses the percentage of flights that leave the gate within this time margin.
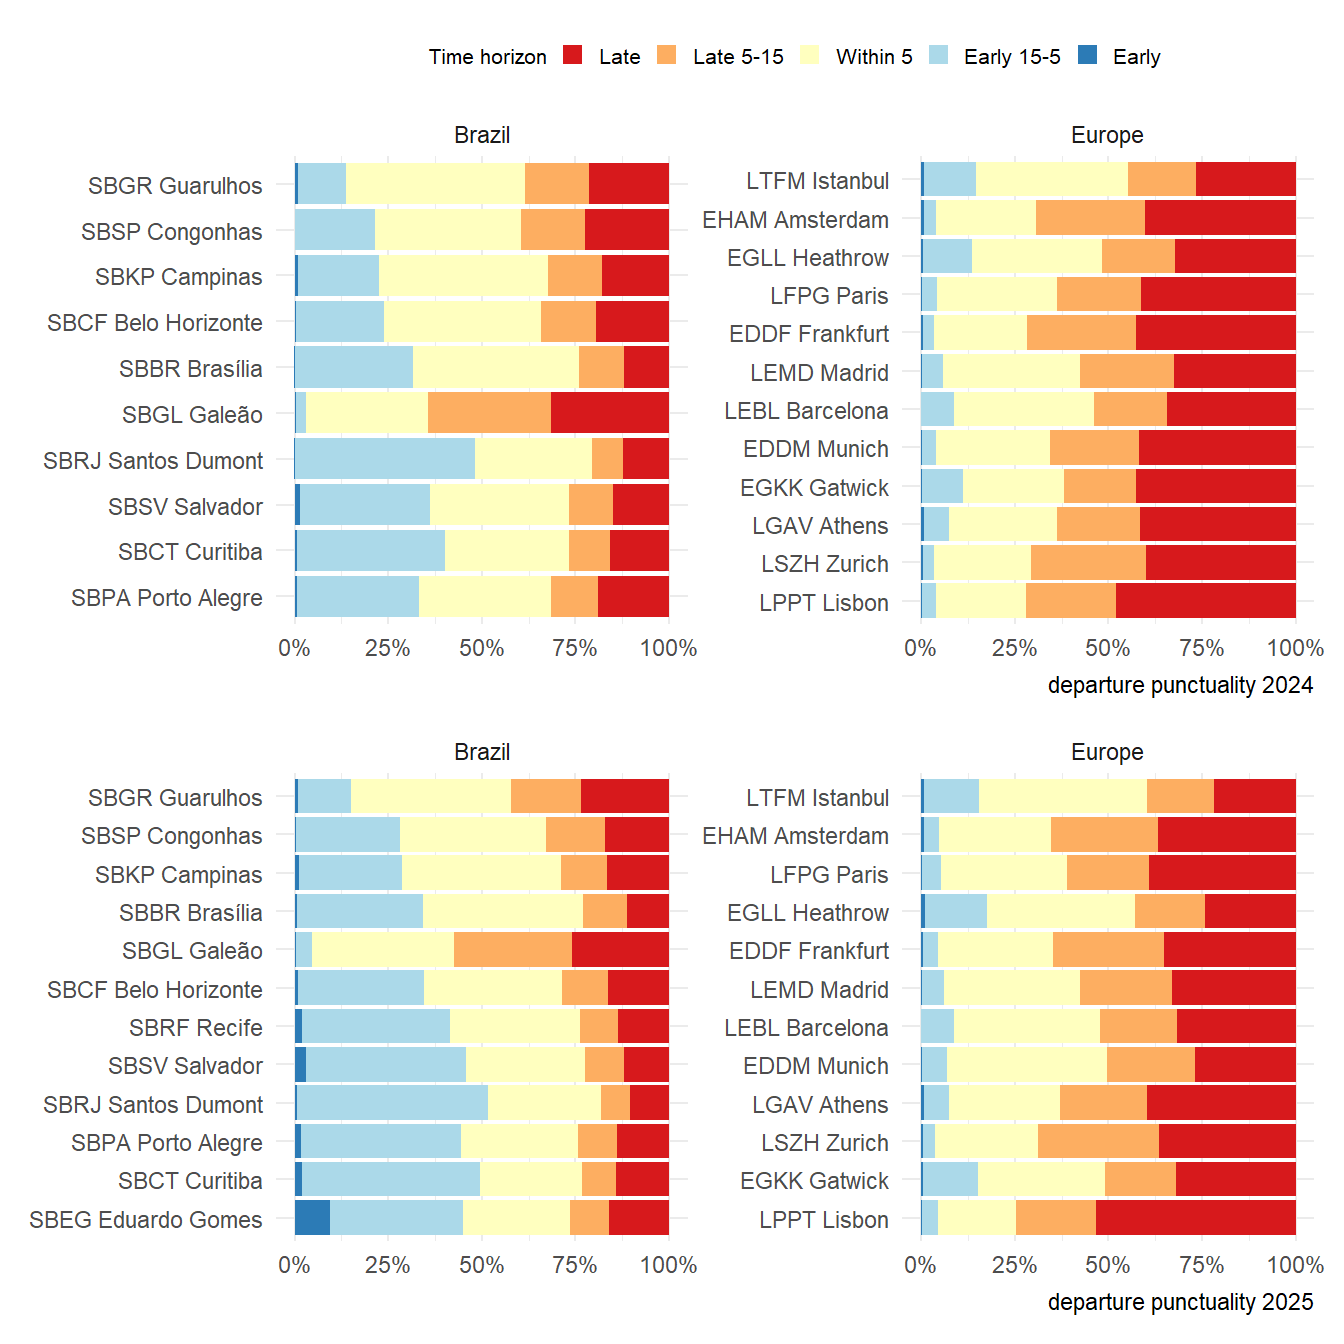
Figure 4.5 presents the departure punctuality results for the study airports. The 2025 data show that, overall, airports perform better in managing outbound traffic, although challenges remain. Different from arrival punctuality, where Brazilian airports showed a high share of early arrivals and wide variability across the network, departure punctuality metrics appear comparatively stronger, especially in terms of flights departing within the punctuality (-/+ 15 min) time window.
Departure punctuality appeared higher in Brazil in 2025 than in Europe. The share of departures within the -/+15 minute window reached 81% across the Brazilian study airports compared with 66% across the European study airports. The European value improved materially from 62% in 2024, but still indicates that about one third of departures remained outside the punctuality window. Further research may help to clarify the factors driving this phenomenon.
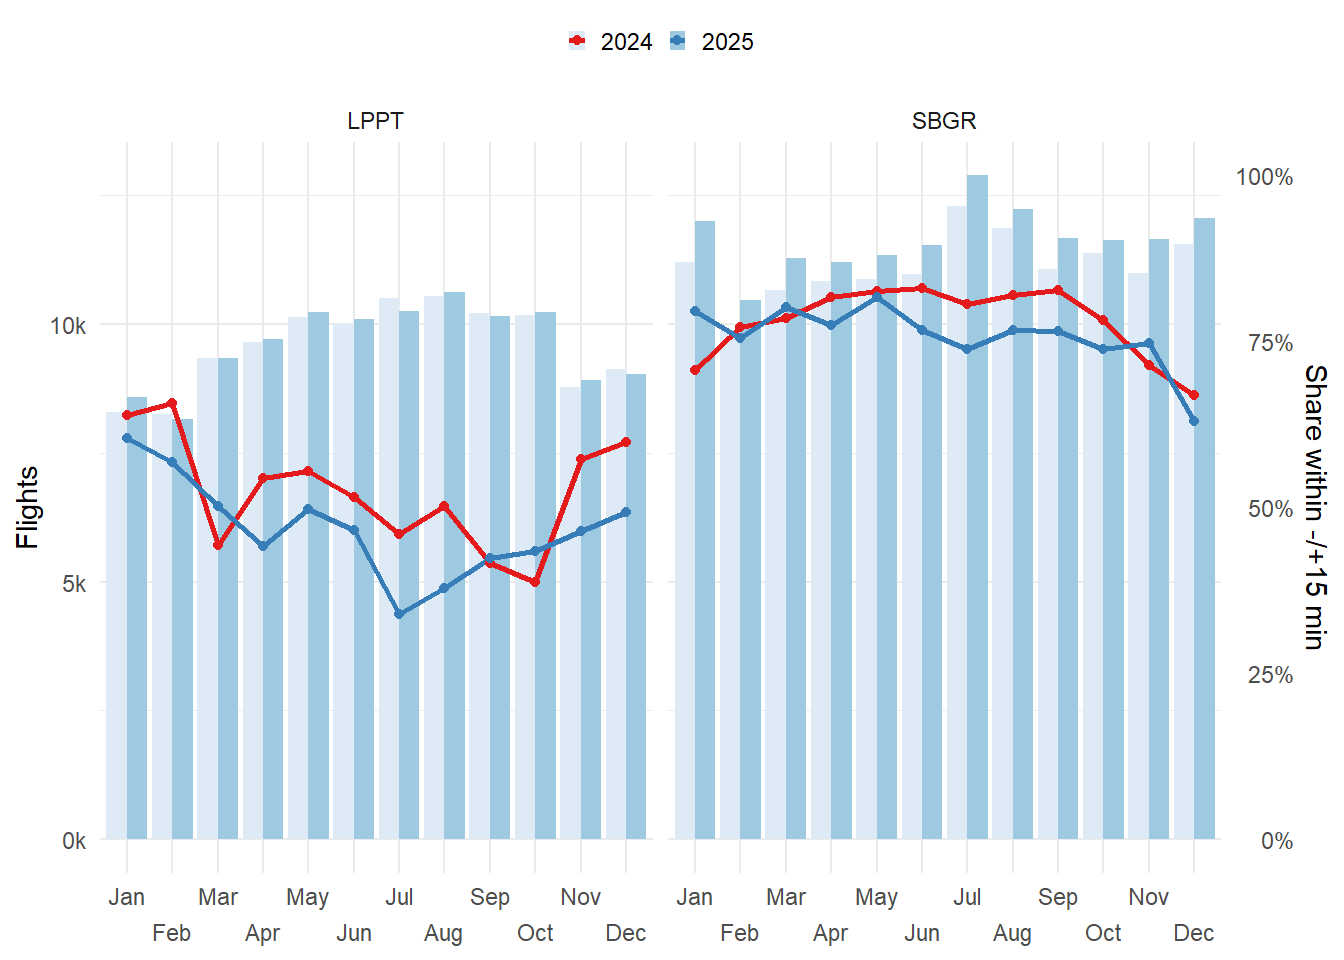
Comparing the observed punctuality performance for departures at Lisbon (LPPT) and Guarulhos (SBGR), c.f. Figure 4.6, depicts the lower level of departure punctuality at LPPT. It appears that the punctuality performance followed broadly the seasonal development. This is in line with the earlier commentary on the network level effects impacting the overall delay situation through increased reactionary delays driven by significant ATFM delay constraints. The departure performance observed at Guarulhos is in line with the arrival punctuality pattern showing the same behaviour across 2024 and 2025.
The preceding section highlighted how the general traffic conditions in the previous years influenced the dependability of arrival schedules. In this section, we assess the degree of departure punctuality measured as the difference between the scheduled departure versus the observed actual off-block time. Figure 4.7 shows the overall departure punctuality at Brazilian and European airports in 2024 and 2025.
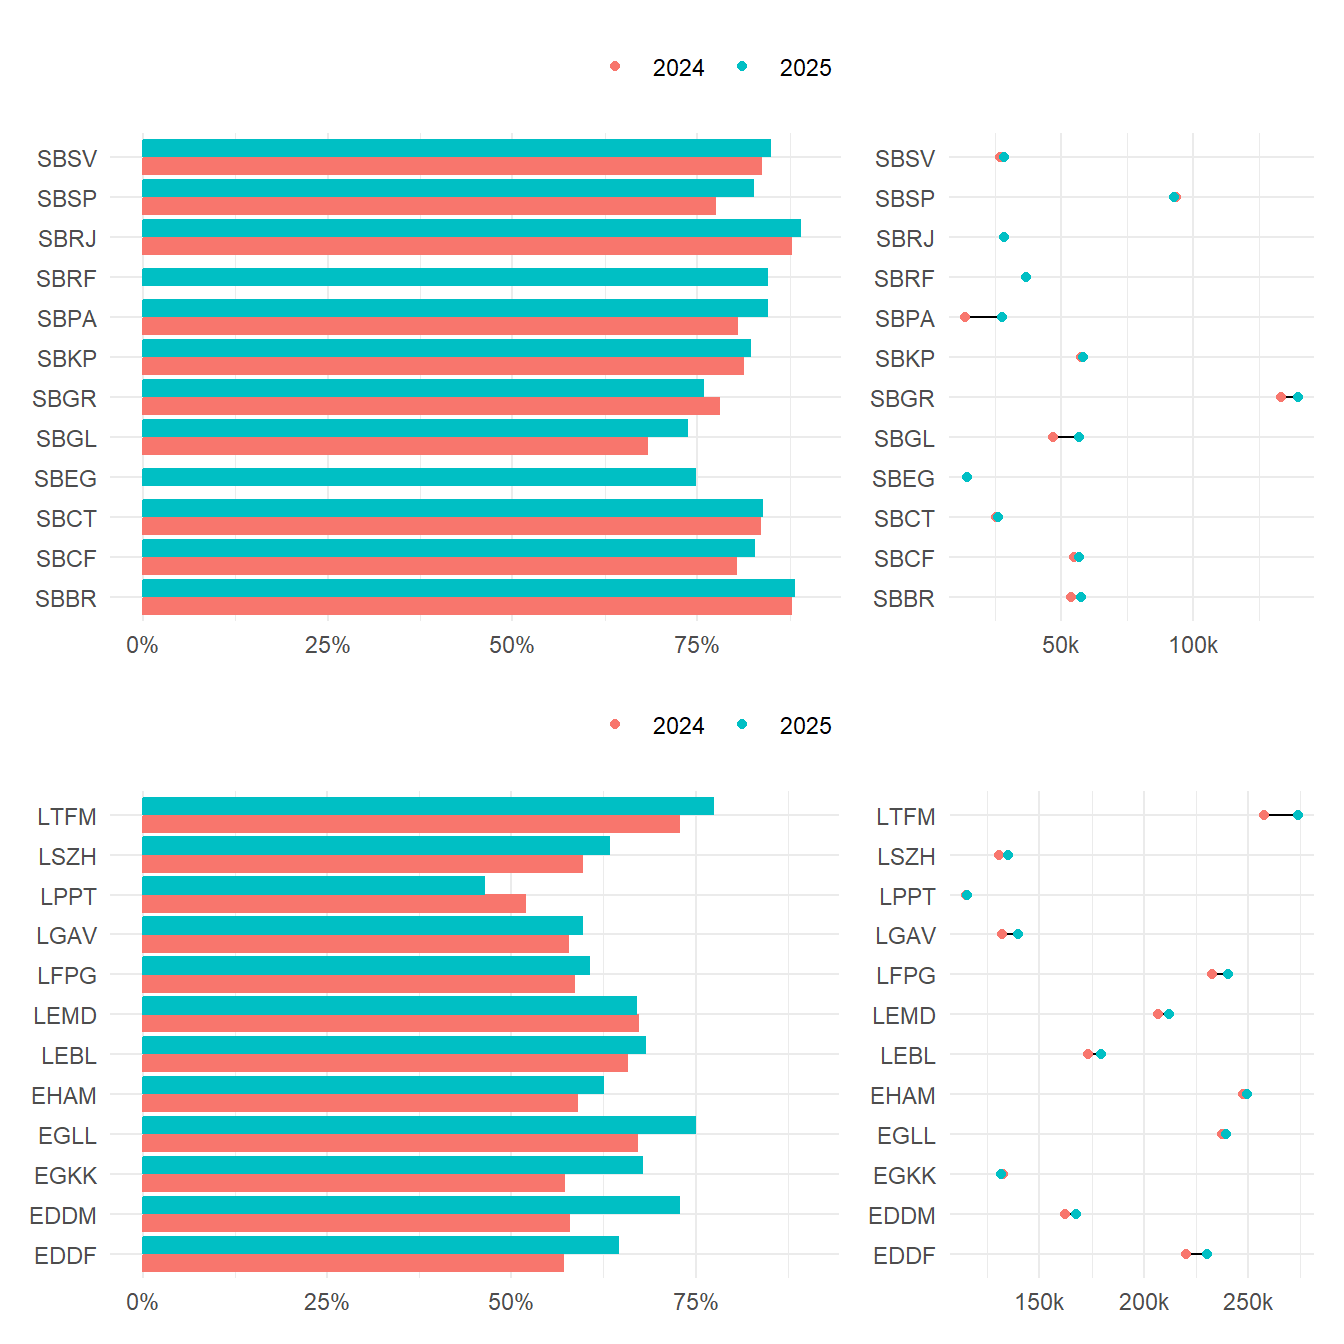
In analogy to the previous section, Figure 4.7 shows a side-by-side view of departure punctuality and movement evolution between 2024 and 2025 for each of the study airports.
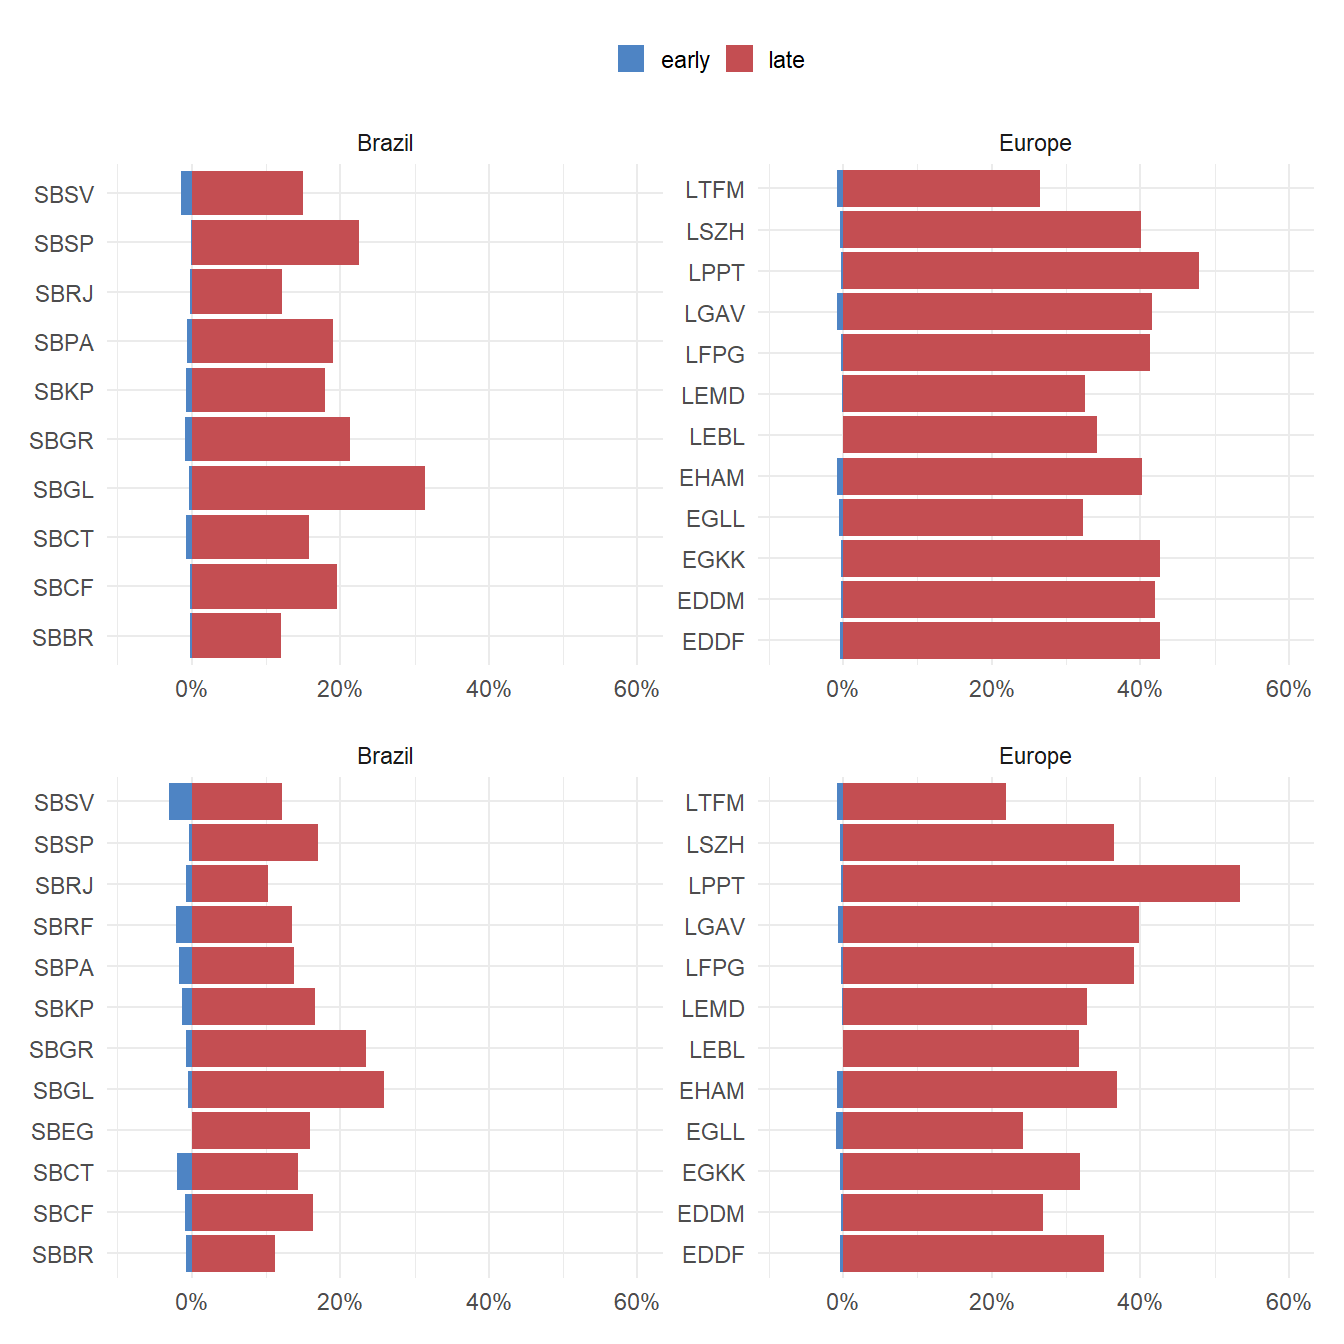
The change of the share of early and late departures in 2024 and 2025 is shown in Figure 4.8. The observed departure punctuality at Brazilian and European airports demonstrates a positive operational behaviour: early departures before scheduled time are relatively small in both regions, which is favourable for maintaining schedule stability.
In Brazil, the patterns observed in 2024 and 2025 are notably similar across the study airports, indicating consistent operational practices. Despite this, most Brazilian airports maintained a balanced distribution, with a large proportion of flights departing within the -/+ 15-minute window.
There is stark contrast in terms of overall departure punctuality between Brazil and Europe. In Europe, 33% of departures were more than 15 minutes late in 2025. The highest share was observed at LPPT, where 53% of departures were late. Lisbon (LPPT) is therefore the strongest departure outlier in 2025 and provides a concrete anchor for the comparison with Guarulhos (SBGR). The amplification effect is evident. Delayed departures for regional flights will ultimately cause downstream delays. Disrupted schedules pose challenges to the local capacity management and surface operations. However, they also contribute to challenges of flow control on the network level. The associated imbalances influenced negatively the overall network sequencing and flow management.
While surface movement operations appear stable at most airports, the growing share of late departures at specific locations signals the need for continuous monitoring and management interventions to assure the predictability of operations.
4.3 Summary
Arrival and departure punctuality play an important role in terms of balancing demand and capacity.
Arrival punctuality revealed distinct regional patterns. Brazilian airports continued to show a high share of early arrivals, largely due to the use of built-in buffer times in flight schedules. While this improves on-time performance metrics, it complicates air traffic management by reducing predictability. In contrast, European airports generally maintained lower shares of early arrivals and a higher share of delayed arrivals. A closer operational comparison of the behaviour at Guarulhos (SBGR) and Lisbon (LPPT) highlighted the challenges faced by large, high-density hubs in sustaining punctuality under growing demand.
Departure punctuality showed a distinct difference between both regions and when compared to the wider spread of the arrival punctuality. Early departures remained relatively rare, supporting schedule stability. However, challenges persisted at European airports where late departures remained high. Overall, the departure punctuality in Europe was poor compared to Brazil. These patterns emphasize how local operational and network constraints, weather disruptions, and surface management practices directly influence performance.
In both regions, maintaining high predictability levels remains critical to support efficient surface operations, arrival sequencing, and passenger experience. Continuous adaptation, proactive operational planning, and effective resource management are essential to sustain and improve predictability, especially as traffic demand continues to grow. As both regions are committed to move toward trajectory-based operations, the management of highly predictable air traffic flows will require attention.
See CODA report at https://www.eurocontrol.int/publication/all-causes-delays-air-transport-europe-annual-2022.↩︎