The ACE benchmarking project analyses the cost-effectiveness and productivity of 38 European Air Navigation Service Providers (ANSPs) in Europe. It examines both individual ANSPs and the Pan-European ATM/CNS system as a whole.
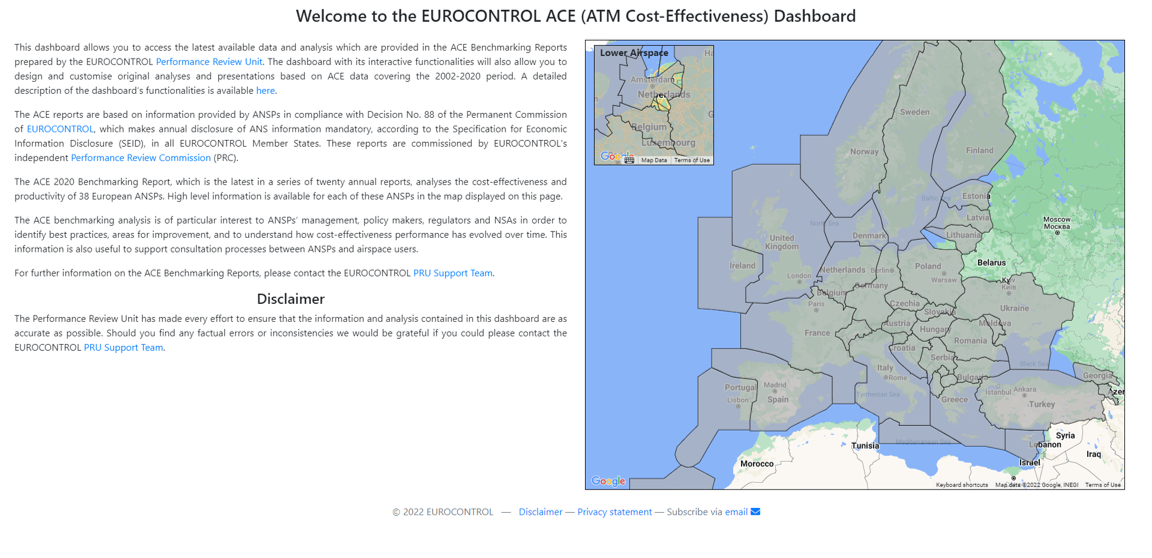
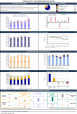
In addition to the publication of interim and final annual reports, an interactive dashboard containing the whole ACE data (2002-2024) has been developed. It enables the aviation community to build customised views on ANSPs economic performance.
ACE Benchmarking Report 2026 Edition
This report is based on the 2024 data submitted by ANSPs in July 2025. It demonstrates the recovery of the Pan-European ATM system from the shock caused by the COVID-19 pandemic across several key metrics. Therefore, in addition to analysis of 2024 European ATM cost-effectiveness, it also includes a retrospective analysis of the impact of the COVID-19 pandemic on European ATM, including the measures implemented in response and lessons learned.
€469
(-1.4% vs 2023)
ATM/CNS provision costs per composite flight-hour
€314
(-1.7% vs 2023)
Support costs per composite flight-hour
€153
(+3.8% vs 2023)
ATCO employment costs per ATCO-hour
0.98
(+4.7% vs 2023)
ATCO-hour productivity
The ATM/CNS provision cost‑effectiveness indicator reached €469 per composite flight‑hour in 2024, the lowest level since 2002 in real terms.
2024 was marked by post‑COVID recovery, with traffic, revenues, costs and staffing levels all surpassing 2019 values at the Pan‑European system level.
Following the temporary adjustments to staffing and the slowing of some investment programmes during the COVID‑19 crisis, 2024 showed clear signs of renewed capacity building.
ANSPs increased recruitment and training of ATCOs, and capital expenditures rebounded sharply. These developments indicate that several ANSPs have been actively expanding their operational capability in a context of robust traffic recovery at the Pan-European system level. This is essential given the record 29.6 million minutes of ATFM delays recorded in 2024, generating an estimated €3.9 billion in costs for airspace users.
As highlighted repeatedly in PRC reports, insufficient ATC capacity results in disproportionately higher costs for airspace users and passengers, often exceeding the cost of deploying additional ATCO resources. Moreover, given the long lead times for ATCO recruitment and training, even with corrective actions underway, significant ATC capacity constraints and staffing‑related delays may continue to affect network performance for several years.
Regarding the lessons learned from the COVID-19 pandemic:
The crisis exposed the challenges for ANSPs and other ANS stakeholders in making decisions amid high uncertainty on traffic recovery.
Bridging the revenue gap was a primary concern, with ANSPs relying heavily on cash reserves and access to loan financing.
Measures containing cost and capex were also implemented, some of which, while necessary at the time, later proved to constrain recovery and capacity redeployment.
In contrast, greater flexibility in workforce management and operations, as well as a good level of interaction amongst local and European stakeholders, were essential in adapting to the crisis.
ACE Report - Table of contents
Executive summary
- Introduction
Main Chapters:
- Overview of the Pan-European ANS system
- Cost-effectiveness analysis
- Forward-looking cost-effectiveness (2025-2029)
- Retrospective on the ANS industry’s response to the COVID-19 crisis
- Financial indicators calculated from ANSPs’ financial statements
Annexes
- ANNEX 1 – Status of ANSPs 2024 Annual Reports
- ANNEX 2 – Performance indicators used for the comparison of ANSPs
- ANNEX 3 – Performance ratios
- ANNEX 4 – Exchange rates, inflation rates and purchasing power parities (PPPS) data
- ANNEX 5 – Key data
- ANNEX 6 – Performance indicators at FAB level
- Glossary
ACE Handbook
Learn about the scope of the ACE analysis, the processes involved in the production of the report, the factors affecting performance and the indicators used in the ACE analysis.
ANSPs factsheets and individual summary reports
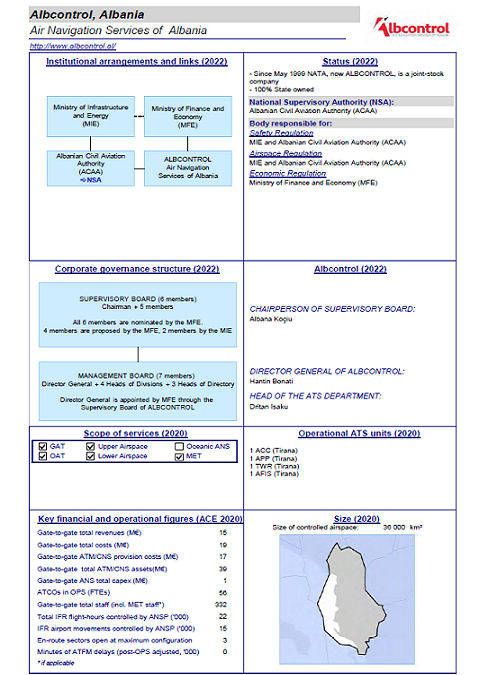
Access information on individual ANSPs institution arrangements, legal status, corporate governance structure, scope of services, etc.
Access information on individual ANSPs cost-effectiveness performance (2019-2024), comparison with peers and historical information on capital investments projects.